Fig. 15
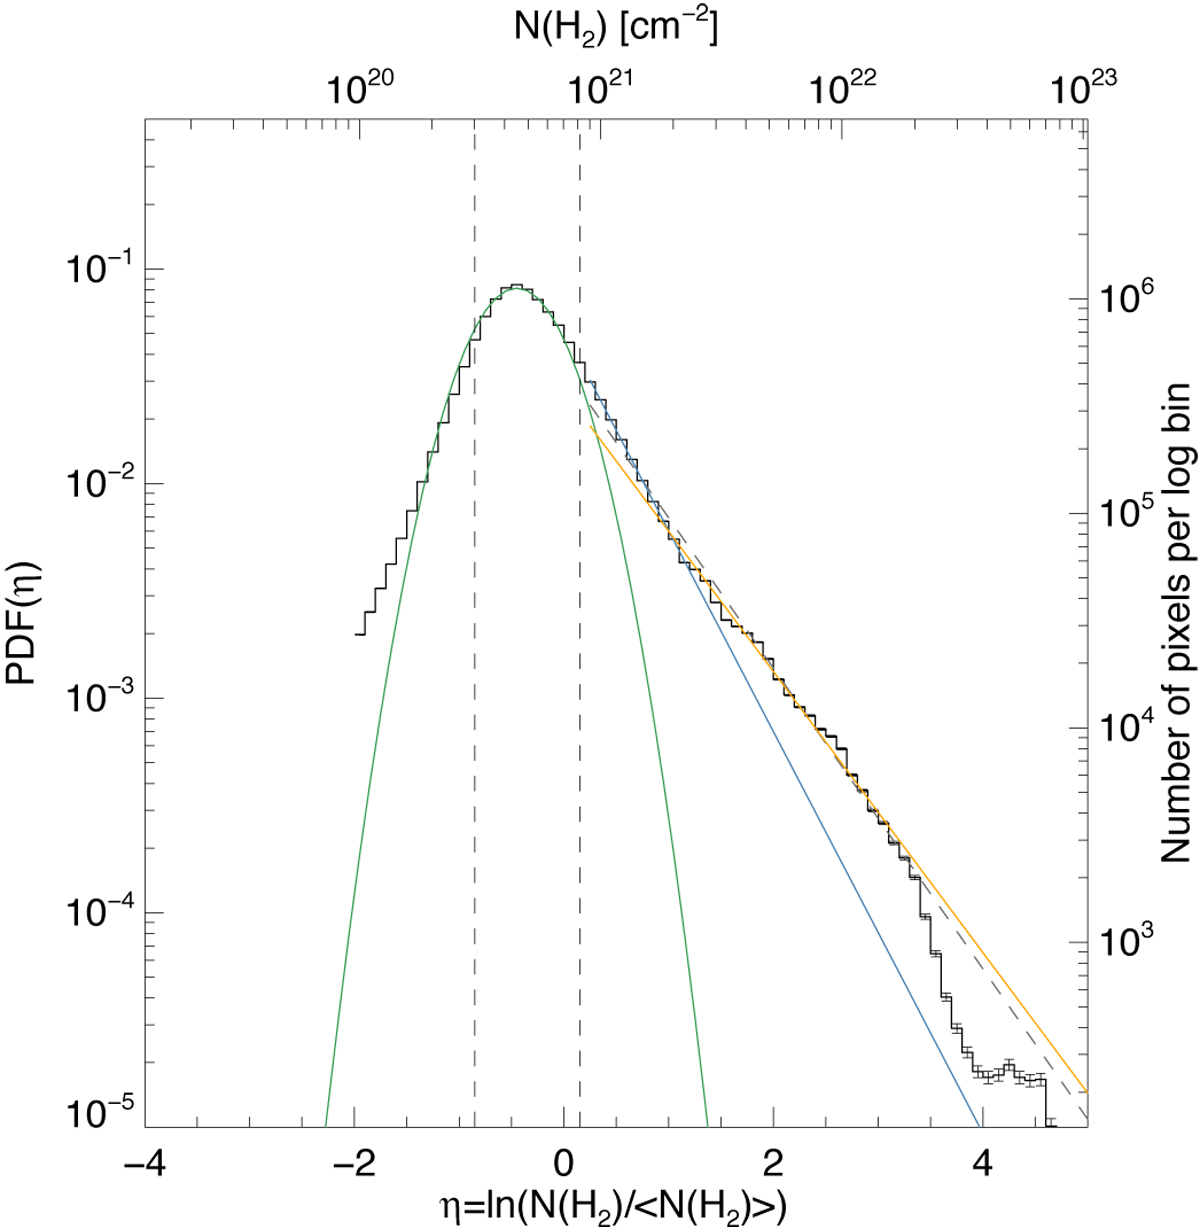
Probability distribution functions of column density for Corona Australis, at an angular resolution of 18″. The black histogram shows the global PDF for the molecular cloud. The two histograms in red and green show the regional PDFs for CrA-A, and CrA-C, respectively.The left y axis is the normalised probability p(η). The pixel size of 3″ means that the errors calculated using Poisson statistics are very small, however the characteristics of the PDF do not change on lower-resolution grids (see also Schneider et al. 2013). The green curve is the Gaussian fit to this PDF between thetwo vertical dashed lines.The right hand dashed line represents the point at which the power-law tail was determined to develop, departing from the log-normal distribution. The dashed grey (full tail), blue (intermediate-mass), and orange (high-mass) lines are the regression fits to the column densities higher than the right hand dashed line, and represent the more dense material on the column density map.
Current usage metrics show cumulative count of Article Views (full-text article views including HTML views, PDF and ePub downloads, according to the available data) and Abstracts Views on Vision4Press platform.
Data correspond to usage on the plateform after 2015. The current usage metrics is available 48-96 hours after online publication and is updated daily on week days.
Initial download of the metrics may take a while.