Fig. 14
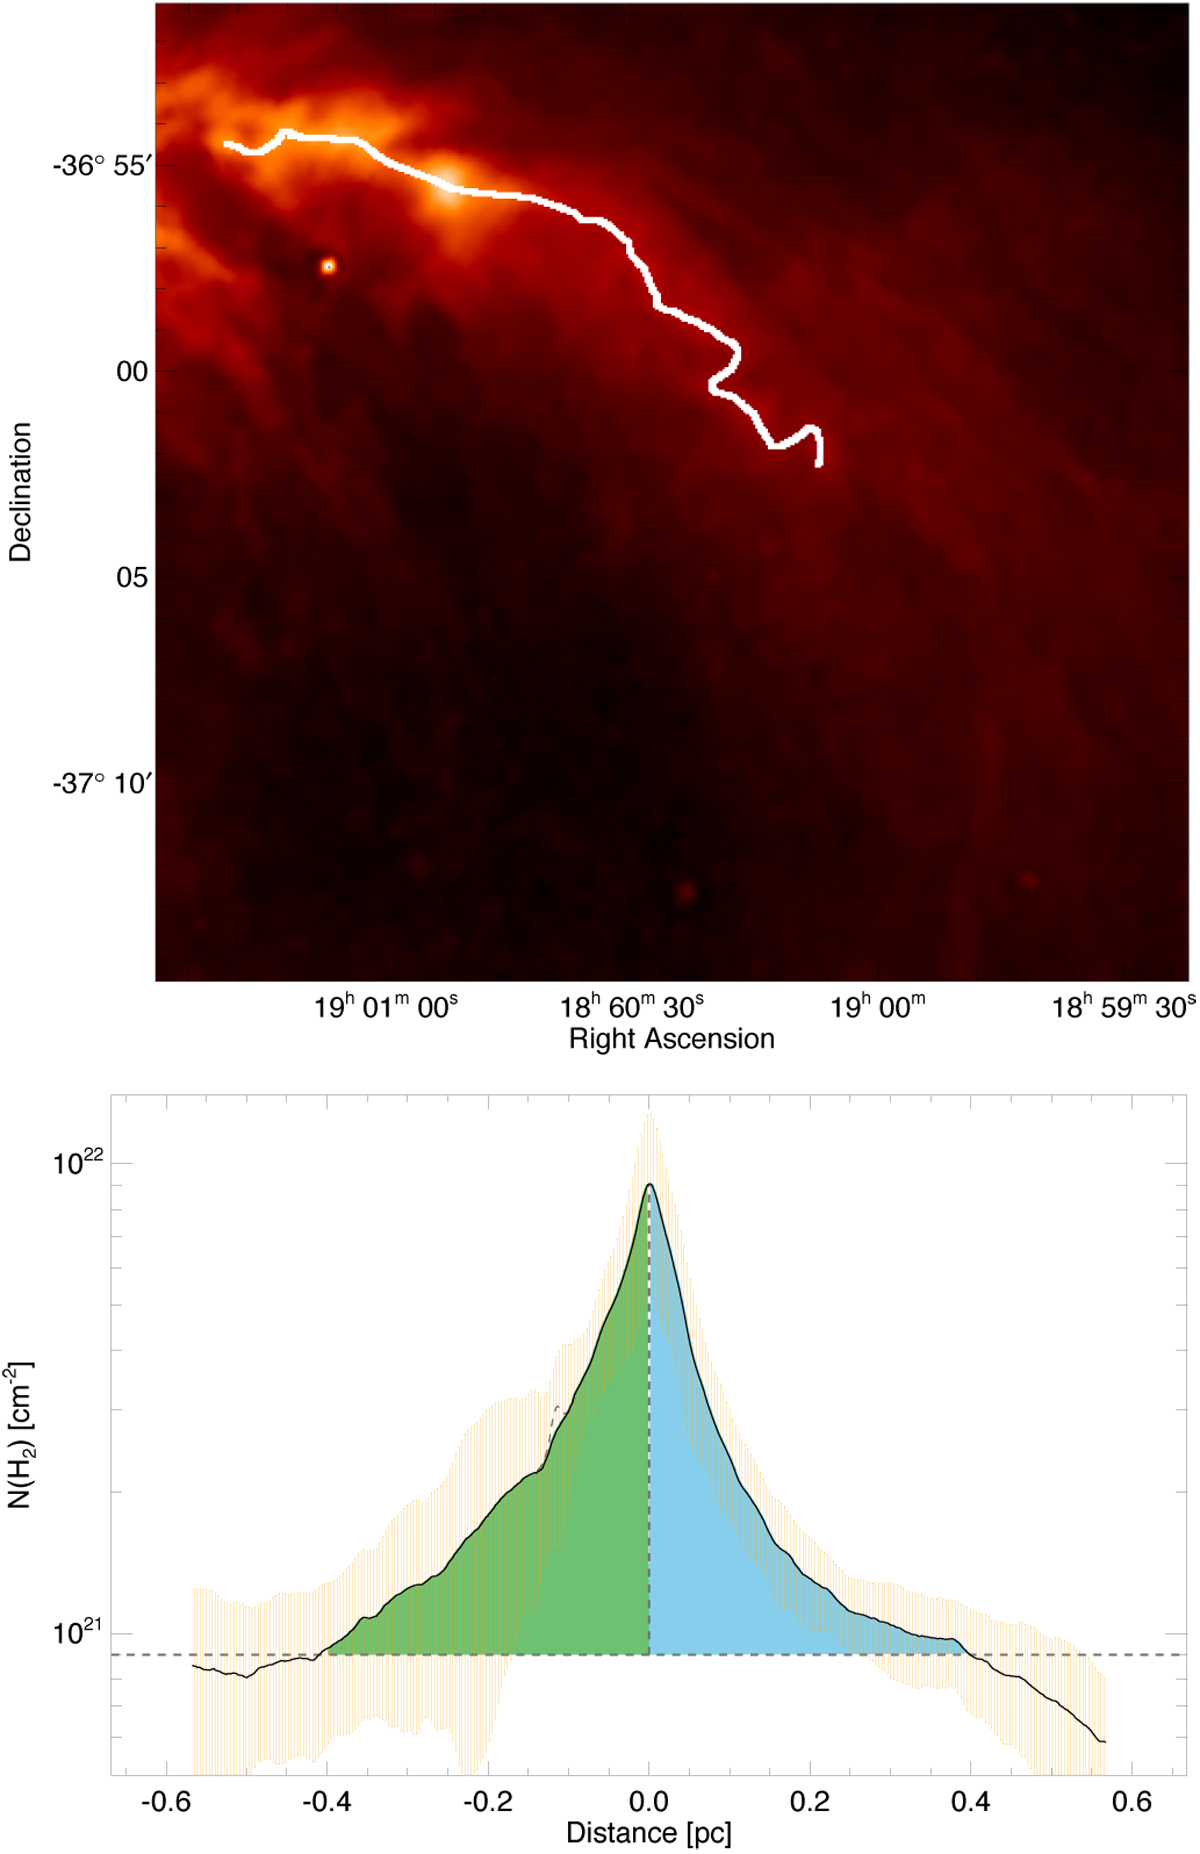
Upper panel: the filament that was located using DisPerSE. The background image is of the high-resolution column density map. Lower panel: the profile taken from the low-resolution column density map using the skeleton shown in the upper panel in white. The x-axis runs fromsouth-east to north-west. The black line is the mean value of the column density at that radius. The dispersion of column densities along that radius is shown in orange. The areas that were integrated to calculate the asymmetry are shaded in green and blue. The vertical dashed line shows the crest position of the filament, and the horizontal dashed line shows the arbitrary background level of the profile. The small dashed curve on the left side of the mean column density curve is the additional column density contribution from the YSO, S CrA, which was manually subtracted from the mean column density profile.
Current usage metrics show cumulative count of Article Views (full-text article views including HTML views, PDF and ePub downloads, according to the available data) and Abstracts Views on Vision4Press platform.
Data correspond to usage on the plateform after 2015. The current usage metrics is available 48-96 hours after online publication and is updated daily on week days.
Initial download of the metrics may take a while.