Fig. 11
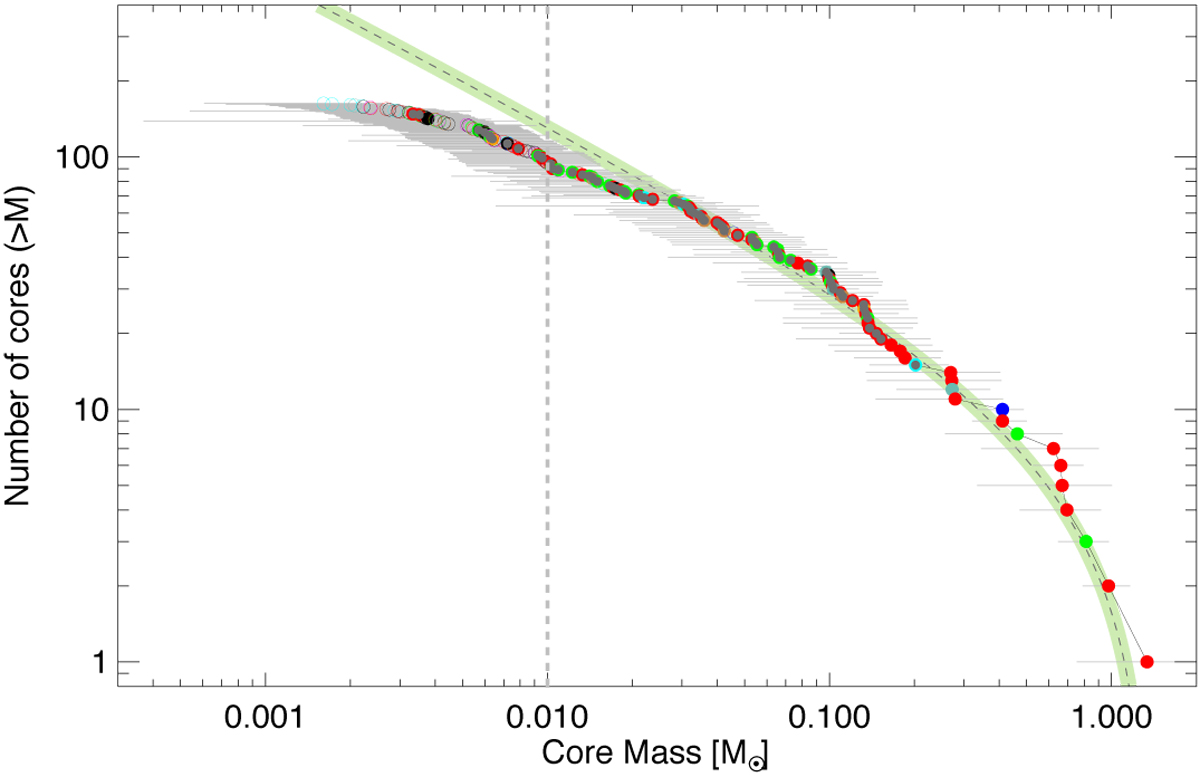
Complementary cumulative mass distribution for all of the starless cores. Colour coding is as in Fig. 5. The quasi-bias-free maximum likelihood estimator power-law index, αMML= 1.59 ± 0.04, is plottedas a light green band with central dashed grey line, and the lower limit was taken as 0.01 M⊙. The vertical dashed light grey line shows the lower truncation limit of 0.01M⊙ that was used for the MML estimator. The equivalent power-law index of the d N∕dlogM distribution for comparison with the binned data of Fig. 10 is ![]() .
.
Current usage metrics show cumulative count of Article Views (full-text article views including HTML views, PDF and ePub downloads, according to the available data) and Abstracts Views on Vision4Press platform.
Data correspond to usage on the plateform after 2015. The current usage metrics is available 48-96 hours after online publication and is updated daily on week days.
Initial download of the metrics may take a while.