Fig. 10
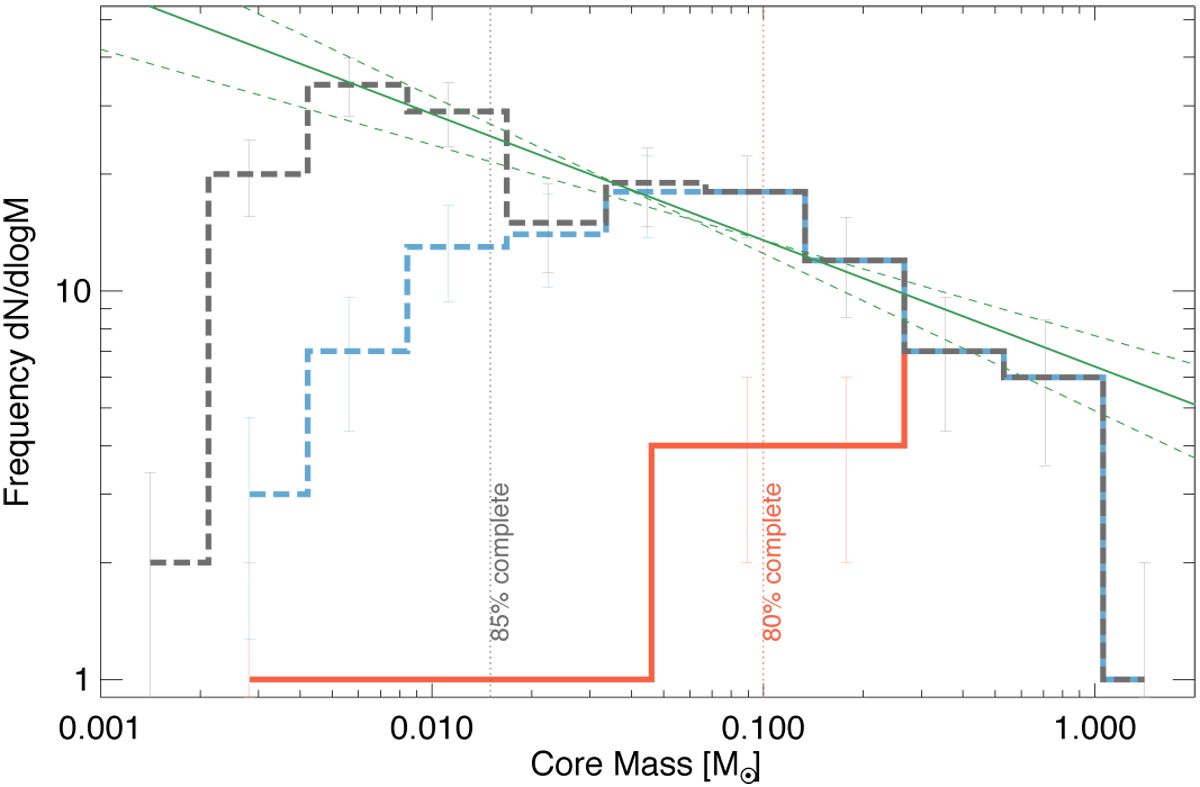
Core mass function (CMF) for subsets of the starless cores. The dashed grey line is the CMF for all of the starless cores regardless of their bound state. The solid red line shows robust prestellar cores, and the dashed blue line shows the additional candidate prestellar cores. The error bars are given as the errors in Poisson statistics for all three histograms. The over-plotted solid green line is the best-fitting power law (index γ = 0.32 ± 0.05) for all of the starless cores with masses 0.01 M⊙ < M <1 M⊙. The 80% completeness limit for robust prestellar cores only is shown as a blue vertical dotted line at 0.1 M⊙, as discussedin Appendix B. The black vertical line is the completeness limit of all starless cores. Only bins including and above this line were used in the fitting of the green line.
Current usage metrics show cumulative count of Article Views (full-text article views including HTML views, PDF and ePub downloads, according to the available data) and Abstracts Views on Vision4Press platform.
Data correspond to usage on the plateform after 2015. The current usage metrics is available 48-96 hours after online publication and is updated daily on week days.
Initial download of the metrics may take a while.