Fig. 9
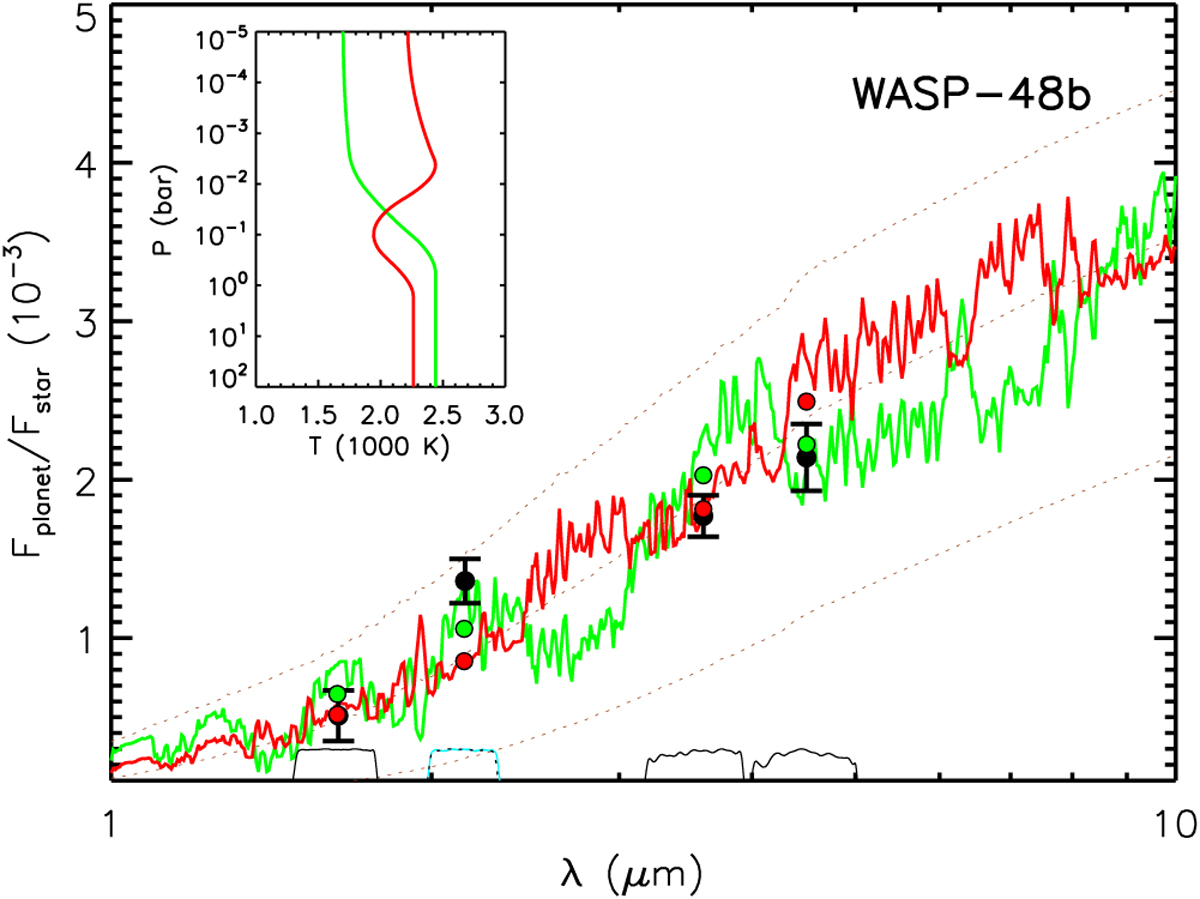
A comparison of the planet-to-star contrast ratios of WASP-48b with model spectra. The red line depicts a model with a thermal inversion and the green line is for a model without an inversion. The black points show the contrast ratios from our analysis (Table 2) and the coloured points show the band-integrated values of the two models. The transmission curves of each filter are plotted in black, though the CFHT Ks -band is plotted in blue and the black dotted line is the Palomar Ks-band. The similarity between the two enables us to analyse them together. The inset plot shows the pressure–temperature profiles of the two models. The three dashed lines are black bodies with temperatures of 1500, 2100 and 2500 K.
Current usage metrics show cumulative count of Article Views (full-text article views including HTML views, PDF and ePub downloads, according to the available data) and Abstracts Views on Vision4Press platform.
Data correspond to usage on the plateform after 2015. The current usage metrics is available 48-96 hours after online publication and is updated daily on week days.
Initial download of the metrics may take a while.