Fig. 1
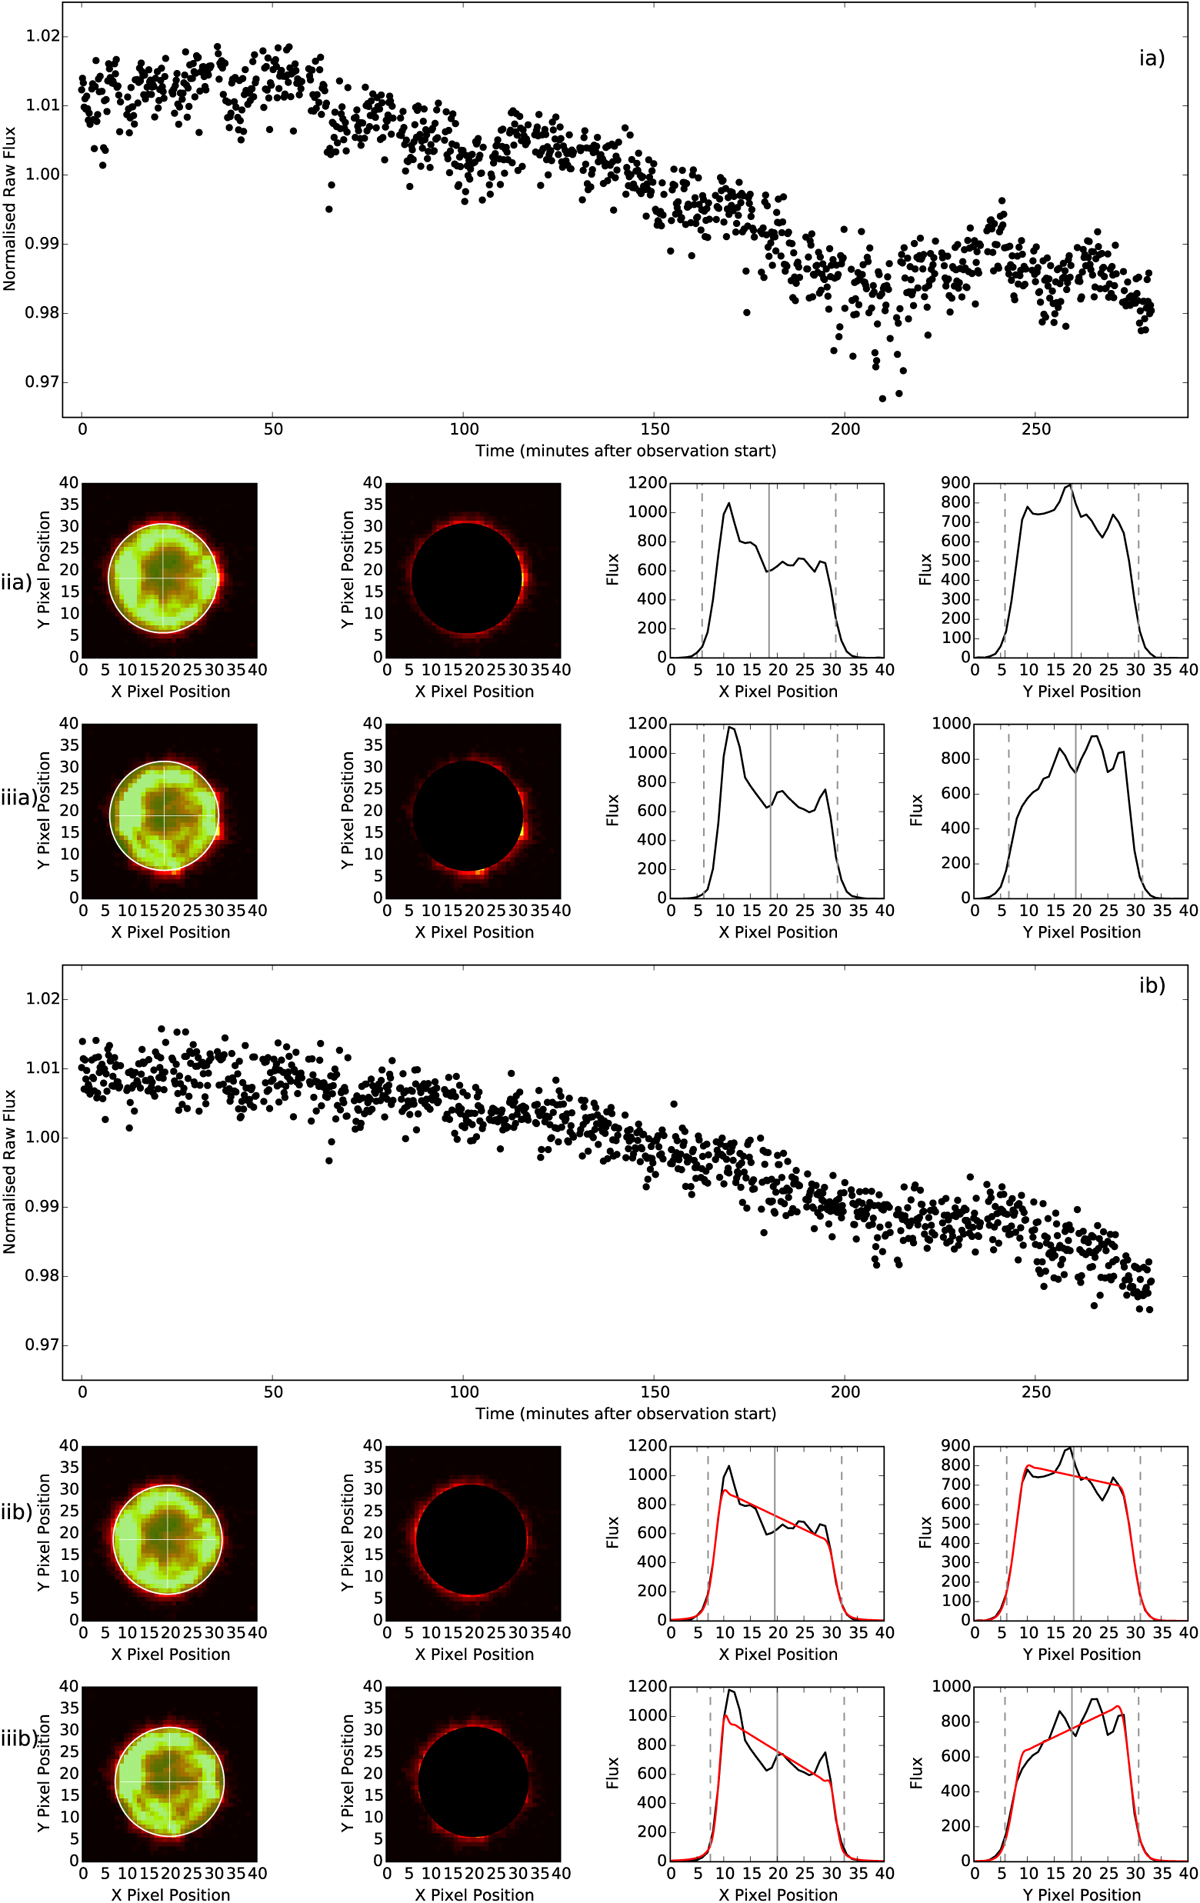
A comparison between the commonly used flux-weighted centroid (FWC) method (labelled a) and the mean profile-fitting (MPF) method used in this work (labelled b). A particularly small aperture is used in this figure to highlight the differences between the two. Panels i: raw lightcurves obtained from each method. Panels ii and iii: two example PSFs with overlaid apertures. Panels from left to right: image of the PSF overlaid with the chosen aperture (white), the aperture subtracted from the PSF, the mean profile of the PSF window in the X-direction and the mean profile of the PSF window in the Y -direction. The gray vertical lines represent the detected center of the PSF for each different profile, while the dashed lines show the placement of the aperture. The red lines in panels iib and iiib show the profile that was detected using the MPF method.
Current usage metrics show cumulative count of Article Views (full-text article views including HTML views, PDF and ePub downloads, according to the available data) and Abstracts Views on Vision4Press platform.
Data correspond to usage on the plateform after 2015. The current usage metrics is available 48-96 hours after online publication and is updated daily on week days.
Initial download of the metrics may take a while.