Fig. 2.
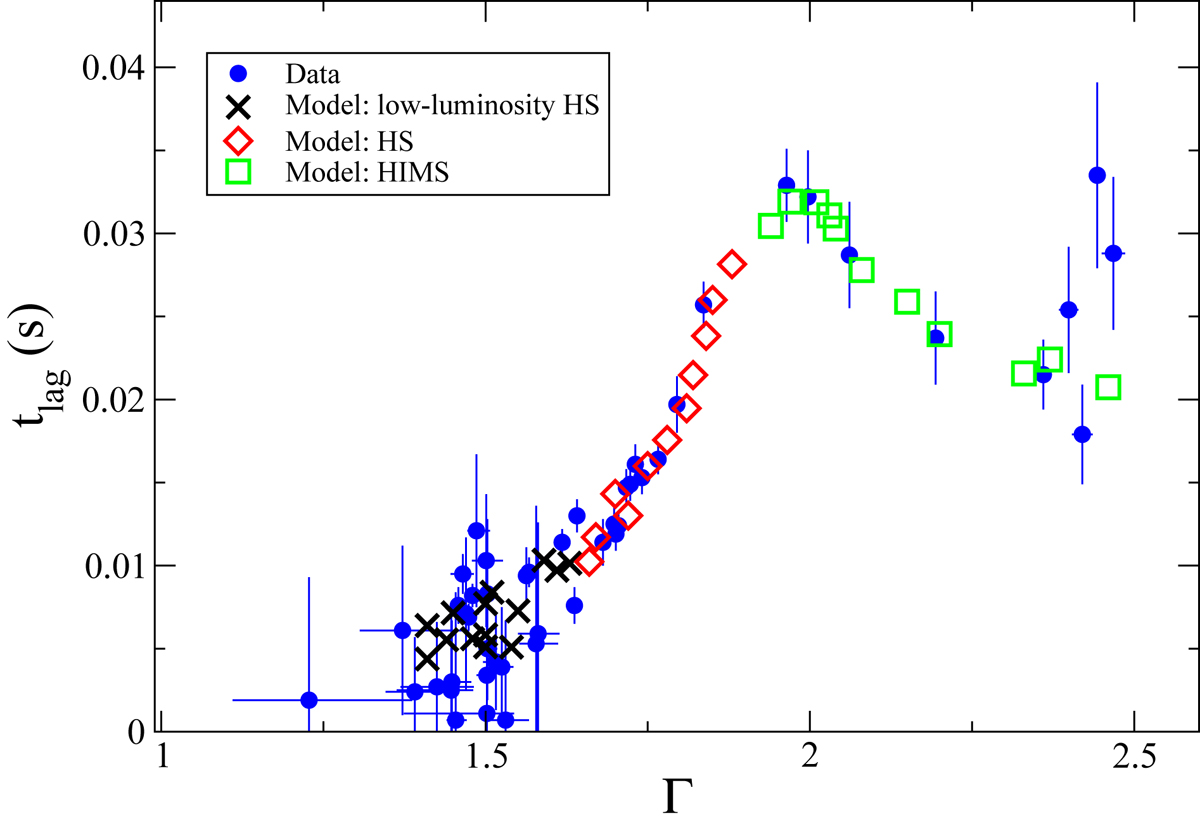
Time lag of the 9–15 keV photons with respect to the 2–6 keV ones as a function of the spectral index Γ of the hard X-rays for the 2006–2007 outburst. The blue circles give the observations and the different symbols give the model results, as follows: black crosses – low-luminosity HS, red diamonds – HS, and green squares – HIMS.
Current usage metrics show cumulative count of Article Views (full-text article views including HTML views, PDF and ePub downloads, according to the available data) and Abstracts Views on Vision4Press platform.
Data correspond to usage on the plateform after 2015. The current usage metrics is available 48-96 hours after online publication and is updated daily on week days.
Initial download of the metrics may take a while.