Free Access
Fig. 9
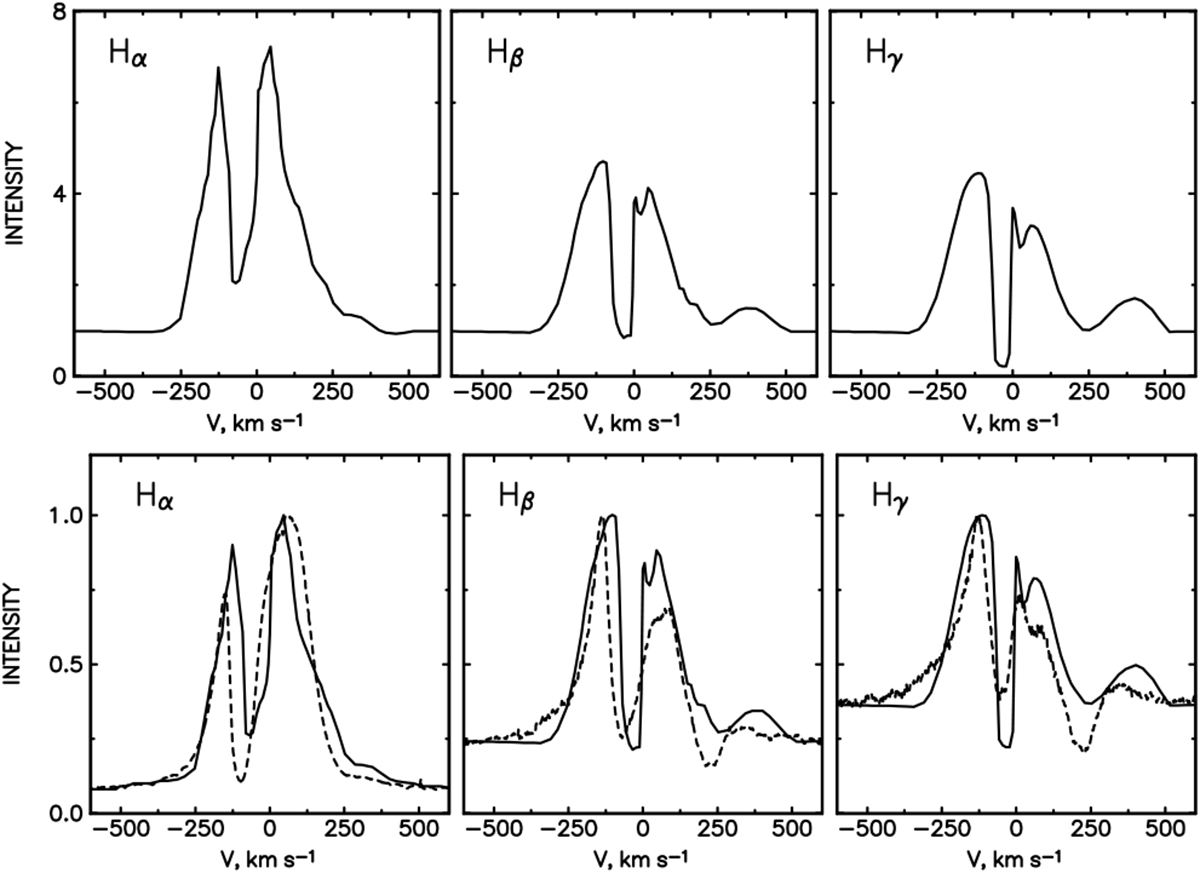
Balmer line profiles in S CrA SE. Upper panels: Hα, Hβ and Hγ line profiles as calculated from the hybrid model MA1 plus DW1 and with an inclination angle of 65°. Lower panels: same profiles normalized to peak intensity (solid curves) superimposed on the observed profiles (dashed curves).
Current usage metrics show cumulative count of Article Views (full-text article views including HTML views, PDF and ePub downloads, according to the available data) and Abstracts Views on Vision4Press platform.
Data correspond to usage on the plateform after 2015. The current usage metrics is available 48-96 hours after online publication and is updated daily on week days.
Initial download of the metrics may take a while.