Free Access
Fig. 4
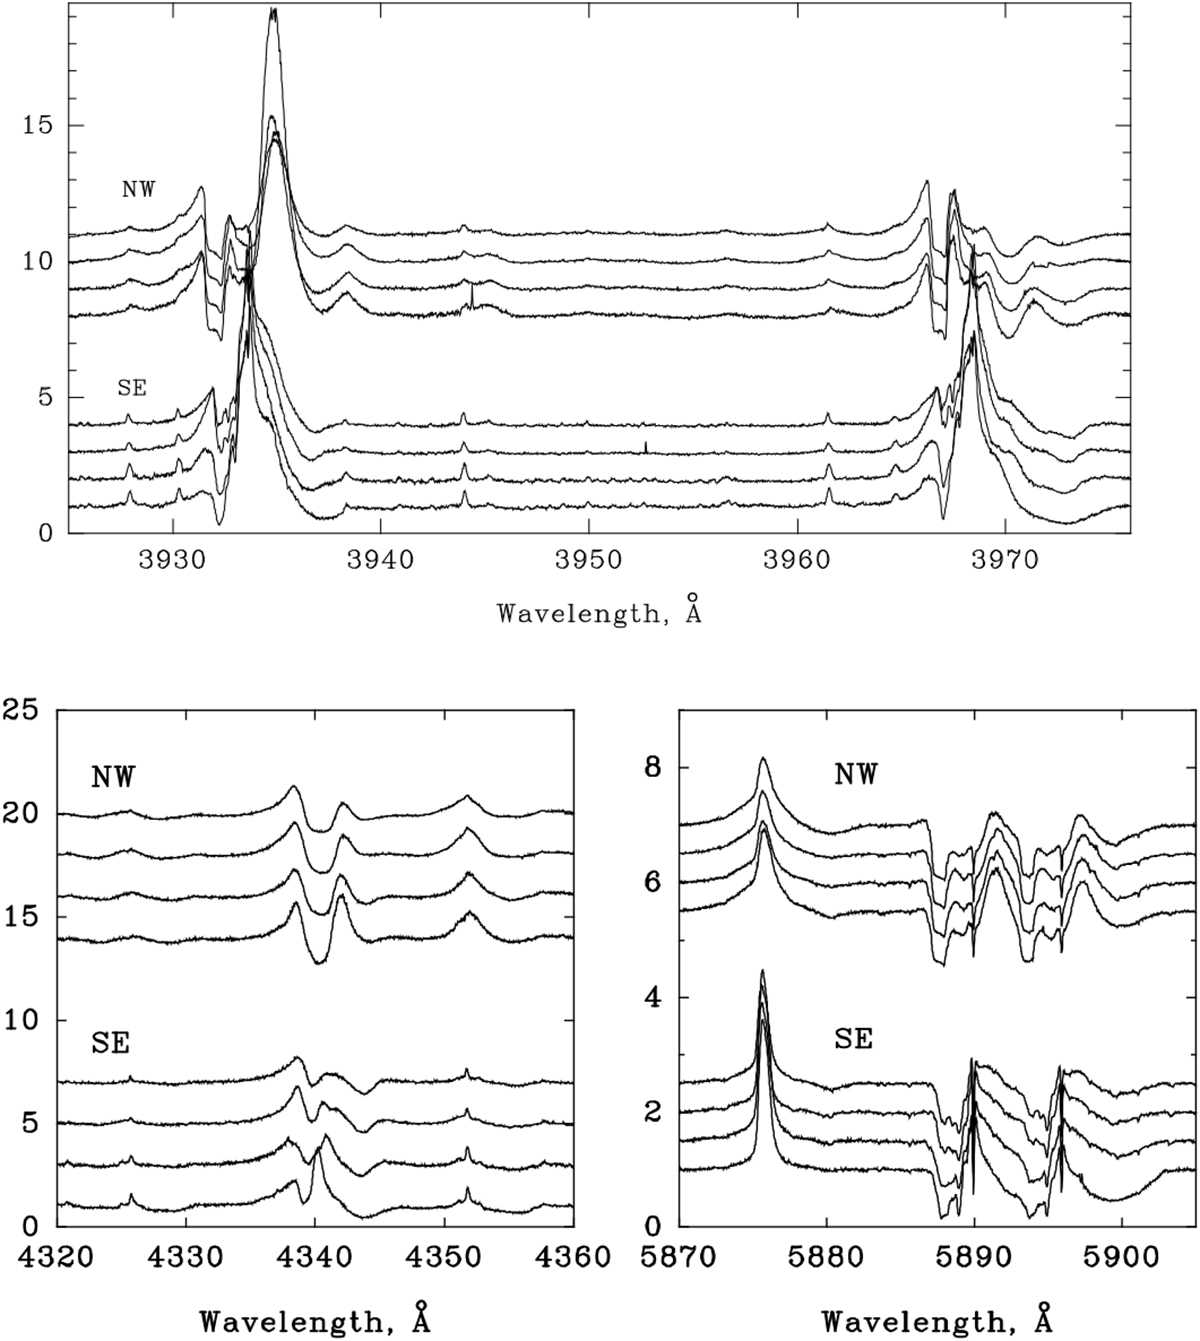
Spectral segments of the two stars taken during 4 nights over the Ca II H & K (upper panel) and Hγ and He I plus Na I D lines (lower panels). Intensities are normalized to the continuum level and time is running upwards.
Current usage metrics show cumulative count of Article Views (full-text article views including HTML views, PDF and ePub downloads, according to the available data) and Abstracts Views on Vision4Press platform.
Data correspond to usage on the plateform after 2015. The current usage metrics is available 48-96 hours after online publication and is updated daily on week days.
Initial download of the metrics may take a while.