| Issue |
A&A
Volume 614, June 2018
|
|
|---|---|---|
| Article Number | A96 | |
| Number of page(s) | 4 | |
| Section | Stellar atmospheres | |
| DOI | https://doi.org/10.1051/0004-6361/201832723 | |
| Published online | 20 June 2018 | |
First detection of bromine and antimony in hot stars★,★★
1
Institute for Astronomy and Astrophysics, Kepler Center for Astro and Particle Physics, Eberhard Karls University,
Sand 1,
72076
Tübingen,
Germany
e-mail: werner@astro.uni-tuebingen.de
2
NASA Goddard Space Flight Center,
Greenbelt,
MD
20771,
USA
Received:
29
January
2018
Accepted:
3
March
2018
Bromine (Z = 35) and antimony (Z = 51) are extremely difficult to detect in stars. In very few instances, weak and mostly uncertain identifications of Br I, Br II, and Sb II in relatively cool, chemically peculiar stars were successful. Adopted solar abundance values rely on meteoritic determinations. Here, we announce the first identification of these species in far-ultraviolet spectra of hot stars (with effective temperatures of 49 500–70 000 K), namely in helium-rich (spectral type DO) white dwarfs. We identify the Br VI resonance line at 945.96 Å. A previous claim of Br detection based on this line is incorrect because its wavelength position is inaccurate by about 7 Å in atomic databases. Taking advantage of precise laboratory measurements, we identify this line as well as two other, subordinate Br VI lines. Antimony is detected by the Sb V resonance doublet at 1104.23/1225.98 Å as well as two subordinate Sb VI lines. A model-atmosphere analysis reveals strongly oversolar Br and Sb abundances that are caused by radiative-levitation dominated atomic diffusion.
Key words: diffusion / stars: abundances / stars: atmospheres / stars: AGB and post-AGB / white dwarfs
© ESO 2018
1 Introduction
Bromine (atomic number Z = 35) and antimony (Z = 51) are rather rare elements in the Universe and hard to detect in stars. Even the adopted solar abundance values (number ratios Br/H = 3.5 × 10⁻¹⁰, Sb/H = 1.0 × 10⁻¹¹; Asplund et al. 2009) were established indirectly from meteoritic measurements. Using improved analysis methods, it has been shown recently that the heavy halogen abundances in chondritic meteorites are significantly lower than previously thought and, for bromine in particular, this amounts to a factor of nine (Clay et al. 2017).
The detection of bromine in stars succeeded only recently. Castelli & Hubrig (2004) and Cowley & Wahlgren (2006) have identified Br II lines in the optical spectra of the mercury–manganese (HgMn) star HR 7143 and the He-weak chemically peculiar (CP) star 3 Cen A, respectively, and bromine excesses of 2.3 and 2.6 dex were measured. Br I lines were reported in the spectrum of the very peculiar star HD 101065 (alias Przybylski’s star) by Bidelman (2005). There is hardly any detection of antimony in stars, and respective claims are considered uncertain. Weak Sb II lines were reported in ultraviolet (UV) spectra of the HgMn star χ Lupi (Leckrone et al. 1999, concluding an Sb excess of 1.6 dex) and in the hot-Am star HR 3383 (Wahlgren & Leckrone 2008). In hotter stars, at higher ionization stages, bromine and antimony were not detected up to now. Here, we announce the identification of Br VI, Sb V, and Sb VI lines in three hot white dwarf stars.
2 Line identification and atomic data
We investigated UV spectra of three hot helium-rich white dwarfs (spectral type DO). In all of them, heavy elements beyond the iron group (Z >29) were detected previously. In HD 149499 B (effective temperature Teff = 49 000 K, surface gravity log (g/cm s−2) = 7.97; Napiwotzki et al. 1995), Chayer et al. (2005) have identified six such species (Ge, As, Se, Sn, Te, and I). Eight trans-iron elements (Zn, Ga, Ge, Se, Sr, Sn, Te, I) were found in PG 0109+111 (Teff = 70 000 K, log g = 8.0; Hoyer et al. 2018). The third DO discussed here (RE 0503−289, Teff = 70 000 K, log g = 7.5; Dreizler & Werner 1996) is a truly outstanding object with respect to its heavy-element variety. Fourteen trans-iron elements (see below) were identified and abundances determined (Rauch et al. 2017, and references therein). Generally, large or extreme overabundances up to five dex oversolar were found, most probably caused by radiative levitation (Rauch et al. 2016).
For our assessment of RE 0503−289 and PG 0109+111, we used spectra taken with the Far Ultraviolet Spectroscopic Explorer (FUSE) and the Hubble Space Telescope (HST). For details of the observations, we refer the reader to our earlier work (Rauch et al. 2017; Hoyer et al. 2018). In addition, weused co-added archival FUSE spectra of HD 149499 B. In total, three Br and four Sb lines were identified (Table 1; Figs. 1 and 2).
2.1 Bromine
The first laboratory investigation of the Br VI spectrum in the far-UV wavelength region was performed by Rao & Rao (1934). In particular, the wavelength of the 4s2 1S0–4s4p 3 P resonance (intercombination) line was determined to 939.57 Å. The energy levels derived from these early measurements are currently still listed in the NIST database (but classified as “not critically evaluated by NIST”, Kramida et al. 2017) and were used, for example, in the linelists established by Kelly (1987) and Morton (2000) and, thus, are widely used in atomic databases. It had, however, been ignored that, not earlier than half a century after the first investigation, Curtis et al. (1984) made a new measurement of that line and found the wavelength 6.7 Å longer (946.3 ± 0.2Å), suggesting that the excitation energies of all triplet levels in Br VI by 756 cm−1 should be adjusted downward. Joshi & van Kleef (1986) further improved the line position measurements of Br VI and found 945.966 Å for the resonance line. In a more recent work, new line spectra measurements were performed and a revised and extended analysis of Br VI was published by Riyaz et al. (2012), with a wavelength of 945.960 ± 0.005Å. As a consequence of this inaccuracy in the databases, Chayer et al. (2005) have erroneously identified a line in the spectrum of the cool DO HD 149499 B located at 939.6 Å as due to this Br VI line. We have identified it in the spectra of RE 0503−289 and HD 149499 B at the correct wavelength (Fig. 1). We cannot offer an identification for the line at 939.6 Å.
Two more Br VI lines can be identified in RE 0503−289 and (weaker) in HD 149499 B. They are the two strongest components (J = 1−1 and 1–2) of the 4s4p 1 Po–4p2 3P multiplet at 1050.55 and 981.42 Å (Fig. 1).
Spectral lines of Br and Sb detected in three He-rich white dwarfs.
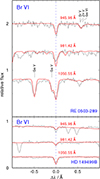 |
Fig. 1 Lines of Br VI in the DO white dwarfs RE 0503−289 (top panel) and HD 149499 B (bottom panel). |
2.2 Antimony
According to the NIST database and the compilation of Morton (2000), the Sb V 5s 2 S–5p 2Po resonance doublet is located at 1104.32 and 1226.00 Å. These values are from level energies (also given in NIST) that were established by Lang (1927) and Badami (1931) based on laboratory work of Gibbs et al. (1929) (see Moore 1971). For his PhD thesis, Chan (1966) performed a very detailed analysis of antimony spectra, which is disregarded in the compilations of Moore (1971) and NIST. He derived a more accurate wavelength of 1104.235 Å for the blue resonance component. This deviates by just 0.04 Å from the line position in our WD spectrum, which is within the wavelength uncertainty of the FUSE observation. For the red component, Chan (1966) gives 1225.983 Å, very close to the original value of 1226.00 Å. The doublet is identified in RE 0503−289 and the blue component in PG 0109+111 (the observations do not cover the red component), see Fig. 2.
Two other Sb V lines at 1506/1524 Å are listed in the NIST database. They were originally thought to be the 5d–5f doublet. They are, however, misidentifications in the early work of Lang (1927), as was already pointed out by Badami (1931). They are not Sb V lines.
We also identify a prominent Sb VI line in RE 0503−289 at 944.40 Å. According to the level energies in the NIST database (which are from Churilov et al. 2000), it is the 5s 3 D3–5p 3F transition. This corresponds to the isoelectronic Sn V line at 1160.74 Å, which is of similar strength in RE 0503−289 (Werner et al. 2012b). The other components of this Sb VI multiplet are expected to be weaker and, occasionally, they are blended with other photospheric lines. Instead, we identify the J = 1−0 component of the 5s 3 D–5p 3Po multiplet at 1043.07 Å (Fig. 2).
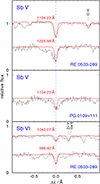 |
Fig. 2 Lines of Sb V in the DO white dwarf RE 0503−289 (top panel) and PG 0109+111 (middle), as well as two Sb VI lines in RE 0503−289 (bottom panel). |
3 Spectral analysis
We performed a quantitative spectral analysis to derive the abundances of Br and Sb from detailed line-profile fits. To this end, we used the Tübingen Model-Atmosphere Package (TMAP1) to compute non-local thermodynamic equilibrium (NLTE), plane-parallel, line-blanketed atmosphere models in radiative and hydrostatic equilibrium (Werner & Dreizler 1999; Werner et al. 2003, 2012a). For HD 149499 B, we computed models including H, He, and Br. In a final formal solution of the radiation transfer equation, line profiles were calculated accounting for fine-structure splitting. The same procedure was performed for RE 0503−289 and PG 0109+111, but in these cases we used our detailed metal-line blanketed model atmospheres from previous work. The RE 0503−289 model includes 26 species (Rauch et al. 2017) plus Br and Sb, and the PG 0109+111 model four species (He, C, N, and O; Hoyer et al. 2018) plus Sb.
Our model atoms for Br and Sb consist of ionization stages IV–VII. The numbers of NLTE levels/lines per ion are 15/1, 5/4, 20/42, and 1/0 for Br IV–Br VII, respectively. Level energies and oscillator strengths fik for Br V and Br VI were taken from Riyaz et al. (2014) and (2012), respectively. Level energies for Br IV were adopted from NIST and the fik value for the considered resonance line is from Warner & Kirkpatrick (1969).
For Sb, the numbers of NLTE levels/lines per ion are 3/1, 5/1, 8/1, and 1/0 for Sb IV–Sb VII, respectively. Level energies for Sb IV were taken from NIST, for Sb V from Chan (1966), and for Sb VI from Churilov et al. (2000). The fik values of the considered Sb IV and Sb V resonance lines are from Morton (2000). That of the considered Sb VI resonance line at 285 Å is from Churilov et al. (2000). The two observed UV lines are subordinate and they were considered in the final spectrum synthesis calculation, only. For their fik values see Table 1.
For both species, Br and Sb, bound-free cross sections were assumed to be hydrogen-like. Line profiles for quadratic Stark broadening and electron collisional rates were computed with usual approximate formulae (see, e.g., Werner et al. 2012b).
For each star, several model atmospheres with different Br and Sb abundances were computed. Our best fits to the observed line profiles are displayed in Figs. 1 and 2. The resulting element abundances are summarized in Table 2. Analysis errors are estimated to ± 0.3 dex, but a similar systematic error for Sb must be accounted for because of the atomic data approximations in our model atom. For RE 0503−289, the results are displayed in Fig. 3 together with all element abundances hitherto measured in this star.
Bromine and antimony abundances measured in He-rich white dwarfs.
4 Summary and conclusions
We reportedthe first detection of the bromine and antimony in hot stars. We identified spectral lines from Br VI as well as Sb V and Sb VI inhelium-rich white dwarfs. As a result of our NLTE model-atmosphere analysis, we found that the Br abundance in RE 0503−289 and HD 149499 B is 1600 and 2500 times solar and the Sb abundance in RE 0503−289 and PG 0109+111 is even 50 000 and 5000 times solar.
In the case of RE 0503−289, Br and Sb are two more trans-iron species in addition to the fourteen already found. Among all white dwarfs, this rich diversity of detected heavy elements is outstanding. The Br and Sb abundances fit into the general trend that all trans-iron elements are extremely overabundant (Fig. 3). As we have discussed earlier, the originfor this phenomenon is most likely rather efficient radiative levitation (Rauch et al. 2017, and references therein).
As we have demonstrated, our ongoing work on the detection of trans-iron elements in hot white dwarfs and respective model-atmosphere analyses repeatedly faces the problem of inaccurate or lacking atomic data, primarily level energies of moderately ionized atoms (ionization stages IV to VIII) and oscillator strengths. For many species, laboratory spectra and their extended analysis are badly needed. A large number of spectral lines remain unidentified in hot white dwarfs and it is a reasonable suspicion that many of these stem from hitherto undetected elements. Good candidates are species with atomic numbers in the range Z = 43 − 49 (Tc–In; as indicated by Fig. 3), or even species beyond the most heavy element discovered so far in any white dwarf (Z = 56, barium).
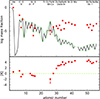 |
Fig. 3 Elemental abundances in the hot white dwarf RE 0503−289. Top: black line indicates solar abundances. Bottom: logarithm of mass fractions relative to solar values. The green dashed line indicates solar abundances. All results except for Br and Sb are taken from Rauch et al. (2017) and references therein. For iron, an upper limit is indicated by the arrow. |
Acknowledgements
The TMAD tool (http://astro.uni-tuebingen.de/∼TMAD) used for this paper was constructed as part of the activities of the German Astrophysical Virtual Observatory. Some of the data presented in this paper were obtained from the Mikulski Archive for Space Telescopes (MAST). STScI is operated by the Association of Universities for Research in Astronomy, Inc., under NASA contract NAS5-26555. Support for MAST for non-HST data is provided by the NASA Office of Space Science via grant NNX09AF08G and by other grants and contracts. This research has made use of NASA’s Astrophysics Data System and the SIMBAD database, operated at CDS, Strasbourg, France.
References
- Asplund, M., Grevesse, N., Sauval, A. J., & Scott, P. 2009, ARA&A, 47, 481 [NASA ADS] [CrossRef] [Google Scholar]
- Badami, J. S. 1931, Proc. Phys. Soc., 43, 538 [NASA ADS] [CrossRef] [Google Scholar]
- Bidelman, W. P. 2005, in Cosmic Abundances as Records of Stellar Evolution and Nucleosynthesis, eds. T. G. Barnes, III, & F. N. Bash, ASP Conf. Ser., 336, 309 [NASA ADS] [Google Scholar]
- Castelli, F., & Hubrig, S. 2004, A&A, 425, 263 [NASA ADS] [CrossRef] [EDP Sciences] [Google Scholar]
- Chan, C. 1966, PhD thesis, The University of British Columbia, Canada [Google Scholar]
- Chayer, P., Vennes, S., Dupuis, J., & Kruk, J. W. 2005, ApJ, 630, L169 [NASA ADS] [CrossRef] [Google Scholar]
- Churilov, S. S., Azarov, V. I., Ryabtsev, A. N., Tchang-Brillet, W.-Ü. L., & Wyart, J.-F. 2000, Phys. Scr., 61, 420 [NASA ADS] [CrossRef] [Google Scholar]
- Clay, P. L., Burgess, R., Busemann, H., et al. 2017, Nature, 551, 614 [NASA ADS] [CrossRef] [Google Scholar]
- Cowley, C. R., & Wahlgren, G. M. 2006, A&A, 447, 681 [NASA ADS] [CrossRef] [EDP Sciences] [Google Scholar]
- Curtis, L. J., Martinson, I., Leavitt, J. A., et al. 1984, Phys. Lett. A, 105, 212 [NASA ADS] [CrossRef] [Google Scholar]
- Dreizler, S., & Werner, K. 1996, A&A, 314, 217 [NASA ADS] [Google Scholar]
- Gibbs, R. C., Vieweg, A. M., & Gartlein, C. W. 1929, Phys. Rev., 34, 406 [NASA ADS] [CrossRef] [Google Scholar]
- Hoyer, D., Rauch., T., Werner, K., & Kruk, J. W. 2018, A&A, 612, A62 [NASA ADS] [CrossRef] [EDP Sciences] [Google Scholar]
- Joshi, Y. N., & van Kleef T. A. M. 1986, Phys. Scr., 34, 135 [NASA ADS] [CrossRef] [Google Scholar]
- Kelly, R. L. 1987, J. Phys. Chem. Ref. Data, 16 [Google Scholar]
- Kramida, A., Ralchenko, Yu., Reader, J., & NIST ASD Team 2017, NIST Atomic Spectra Database (ver. 5.5.1), https://physics.nist.gov/asd [Google Scholar]
- Lang, R. J. 1927, Proc. Natl. Acad. Sci., 13, 341 [NASA ADS] [CrossRef] [Google Scholar]
- Leckrone, D. S., Proffitt, C. R., Wahlgren, G. M., Johansson, S. G., & Brage, T. 1999, AJ, 117, 1454 [NASA ADS] [CrossRef] [Google Scholar]
- Moore, C. E. 1971, Selected Tables of Atomic Spectra – A: Atomic Energy Levels, 2nd edn.; – B: Multiplet tables; N IV, N V, N VI, N VII. Data derived from the analyses of optical spectra (Washington, DC: NSRDS-NBS) [Google Scholar]
- Morton, D. C. 2000, ApJS, 130, 403 [NASA ADS] [CrossRef] [MathSciNet] [Google Scholar]
- Napiwotzki, R., Hurwitz, M., Jordan, S., et al. 1995, A&A, 300, L5 [NASA ADS] [Google Scholar]
- Rao, A. S., & Rao, K. R. 1934, Proc. Phys. Soc., 46, 163 [NASA ADS] [CrossRef] [Google Scholar]
- Rauch, T., Werner, K., Biémont, É., Quinet, P., & Kruk, J. W. 2012, A&A, 546, A55 [NASA ADS] [CrossRef] [EDP Sciences] [Google Scholar]
- Rauch, T., Quinet, P., Hoyer, D., et al. 2016, A&A, 587, A39 [NASA ADS] [CrossRef] [EDP Sciences] [Google Scholar]
- Rauch, T., Quinet, P., Knörzer, M., et al. 2017, A&A, 606, A105 [NASA ADS] [CrossRef] [EDP Sciences] [Google Scholar]
- Riyaz, A., Tauheed, A., & Rahimullah, K. 2012, J. Quant. Spec. Radiat. Transf., 113, 2072 [NASA ADS] [CrossRef] [Google Scholar]
- Riyaz, A., Tauheed, A., & Rahimullah, K. 2014, J. Quant. Spec. Radiat. Transf., 147, 86 [NASA ADS] [CrossRef] [Google Scholar]
- Wahlgren, G. M., & Leckrone, D. S. 2008, Contr. Astron. Obs. Skalnate Pleso, 38, 463 [NASA ADS] [Google Scholar]
- Warner, B., & Kirkpatrick, R. C. 1969, MNRAS, 142, 265 [NASA ADS] [CrossRef] [Google Scholar]
- Werner, K., & Dreizler, S. 1999, J. Comput. Appl. Math., 109, 65 [NASA ADS] [CrossRef] [Google Scholar]
- Werner, K., Deetjen, J. L., Dreizler, S., et al. 2003, in Stellar Atmosphere Modeling, eds. I. Hubeny, D. Mihalas, & K. Werner, ASP Conf. Ser., 288 31 [NASA ADS] [Google Scholar]
- Werner, K., Dreizler, S., & Rauch, T. 2012a, TMAP: Tübingen NLTE Model-Atmosphere Package, Astrophysics Source Code Library [record ascl:1212.015] [Google Scholar]
- Werner, K., Rauch, T., Ringat, E., & Kruk, J. W. 2012b, ApJ, 753, L7 [NASA ADS] [CrossRef] [Google Scholar]
All Tables
All Figures
|
Fig. 1 Lines of Br VI in the DO white dwarfs RE 0503−289 (top panel) and HD 149499 B (bottom panel). |
| In the text | |
|
Fig. 2 Lines of Sb V in the DO white dwarf RE 0503−289 (top panel) and PG 0109+111 (middle), as well as two Sb VI lines in RE 0503−289 (bottom panel). |
| In the text | |
|
Fig. 3 Elemental abundances in the hot white dwarf RE 0503−289. Top: black line indicates solar abundances. Bottom: logarithm of mass fractions relative to solar values. The green dashed line indicates solar abundances. All results except for Br and Sb are taken from Rauch et al. (2017) and references therein. For iron, an upper limit is indicated by the arrow. |
| In the text | |
Current usage metrics show cumulative count of Article Views (full-text article views including HTML views, PDF and ePub downloads, according to the available data) and Abstracts Views on Vision4Press platform.
Data correspond to usage on the plateform after 2015. The current usage metrics is available 48-96 hours after online publication and is updated daily on week days.
Initial download of the metrics may take a while.