Free Access
Fig. 9.
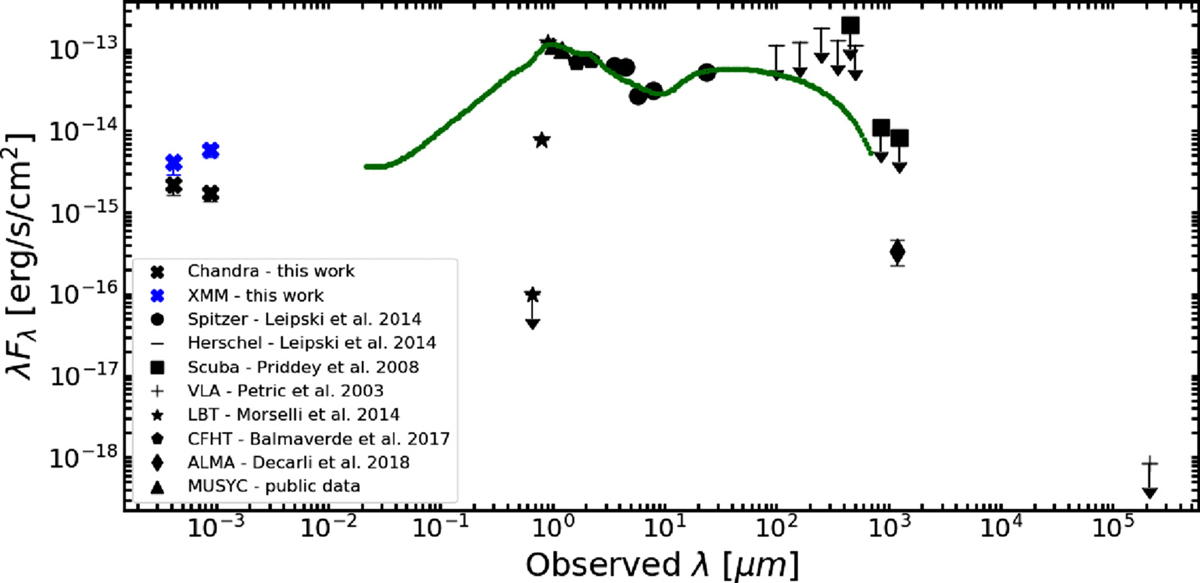
Multi-wavelength SED of SDSS J1030 + 0524. References to the points are labeled. The green curve is the combined SED for luminous lower redshift QSOs taken from Richards et al. (2006). The drop on the SED of SDSS J1030 + 0524 at λ < 1 μm is produced by the Lyman alpha forest.
Current usage metrics show cumulative count of Article Views (full-text article views including HTML views, PDF and ePub downloads, according to the available data) and Abstracts Views on Vision4Press platform.
Data correspond to usage on the plateform after 2015. The current usage metrics is available 48-96 hours after online publication and is updated daily on week days.
Initial download of the metrics may take a while.