Fig. 8.
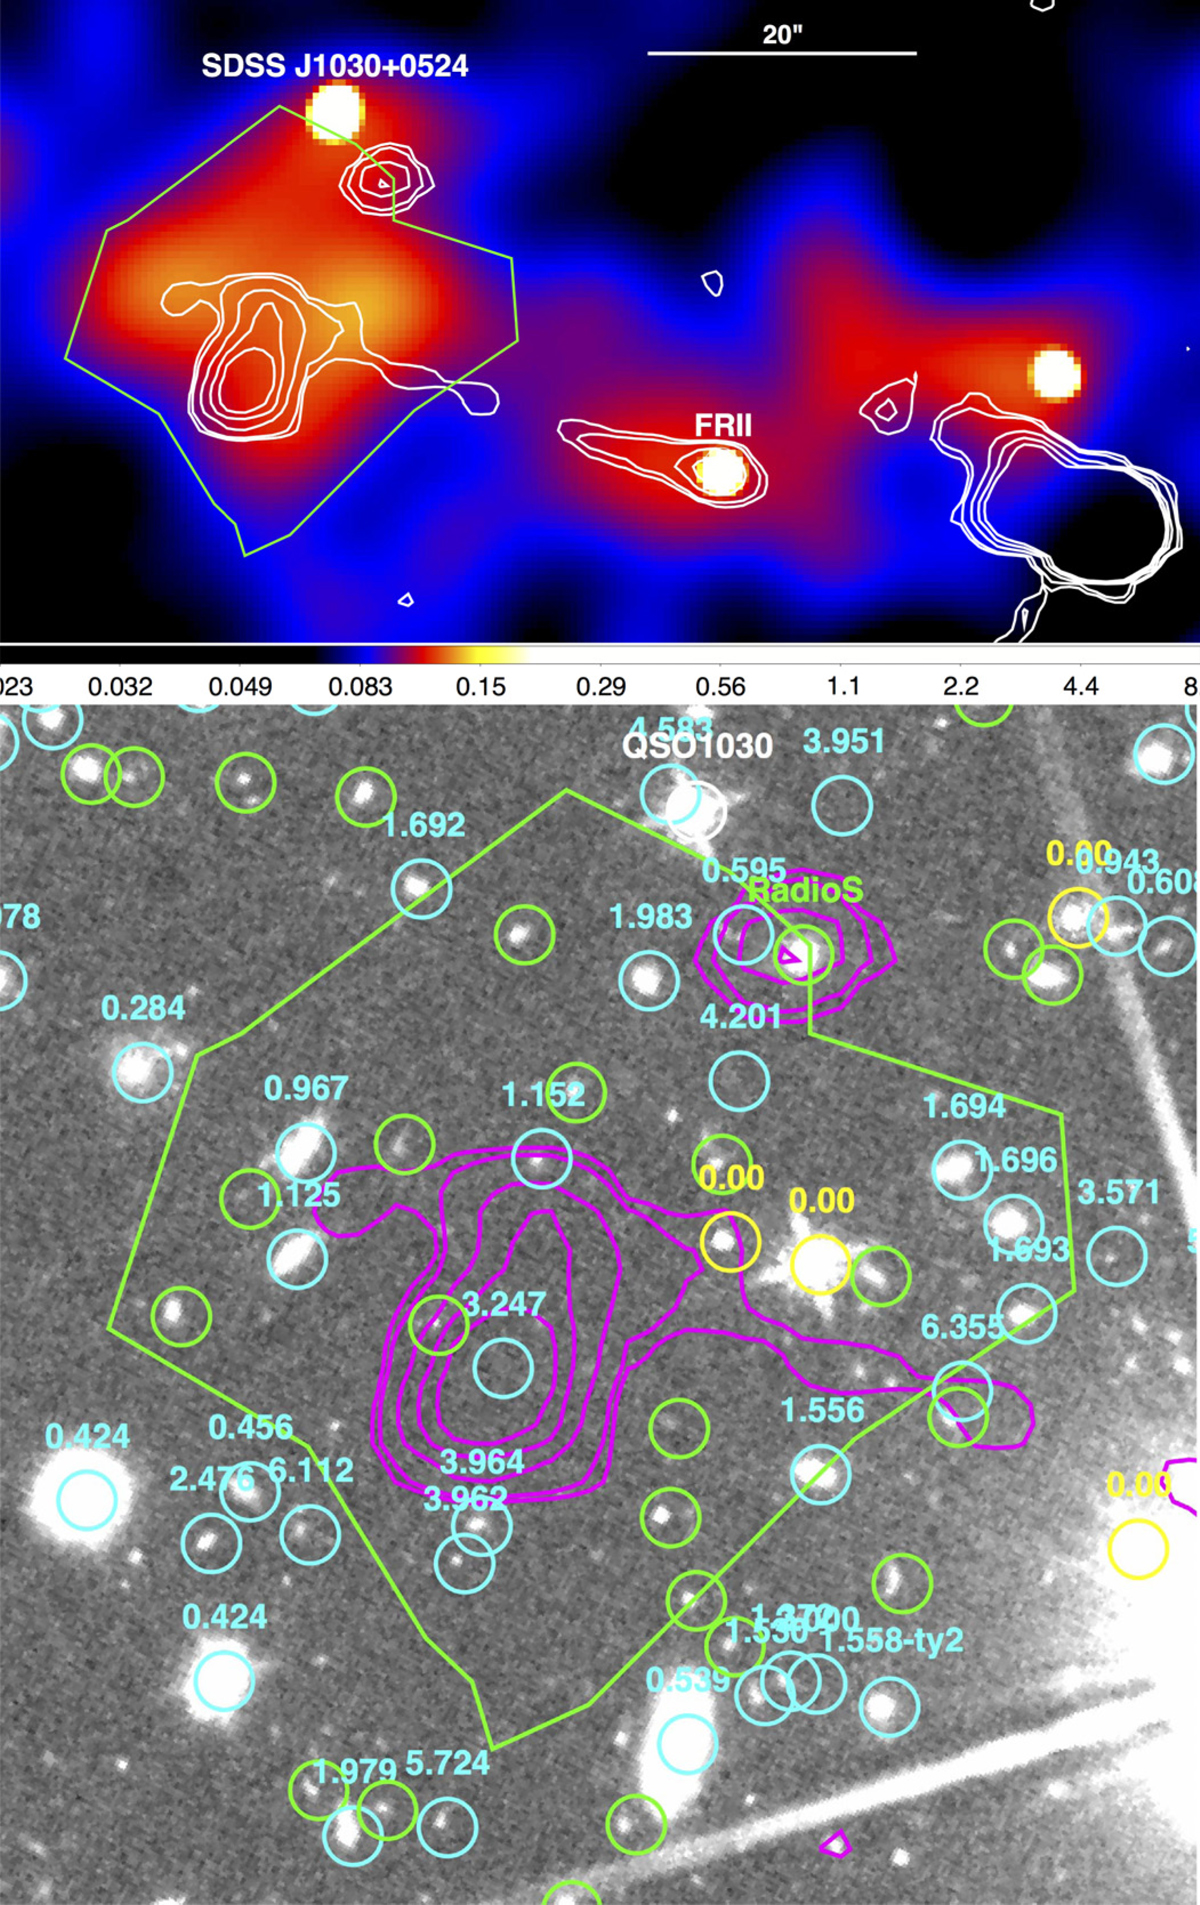
Top panel: smoothed Chandra 0.5 – 7 keV image of the 1.5 × 0.8 arcmin2 field around SDSS J1030 + 0524 and the nearby FRII radio galaxy. Radio contours at 1.4 GHz are shown in white. Contour levels are a geometric progression in the square root of two starting at 60μJy. The green polygon marks the region of diffuse X-ray emission southward of the QSO. Units on the colorbar are counts per pixel. Bottom panel: 0.7′ × 0.7′ HST image in the H-band. Circles are centered at the position of MUSE detected sources. The white circle marks SDSS J1030 + 0524. Cyan circles mark sources for which a redshift was measured, yellow circles are stars, green circles mark sources for which no redshift was measured. Magenta contours mark the emission of radio sources at 1.4 GHz. The radio lobe of a FRII radio galaxy (Petric et al. 2003) falls within the region of X-ray diffuse emission (green polygon). In both panels, another radio source is visible at the edge of the diffuse X-ray emission (6″ south-west the QSO). In all images north is up and east is to the left.
Current usage metrics show cumulative count of Article Views (full-text article views including HTML views, PDF and ePub downloads, according to the available data) and Abstracts Views on Vision4Press platform.
Data correspond to usage on the plateform after 2015. The current usage metrics is available 48-96 hours after online publication and is updated daily on week days.
Initial download of the metrics may take a while.