Fig. 7.
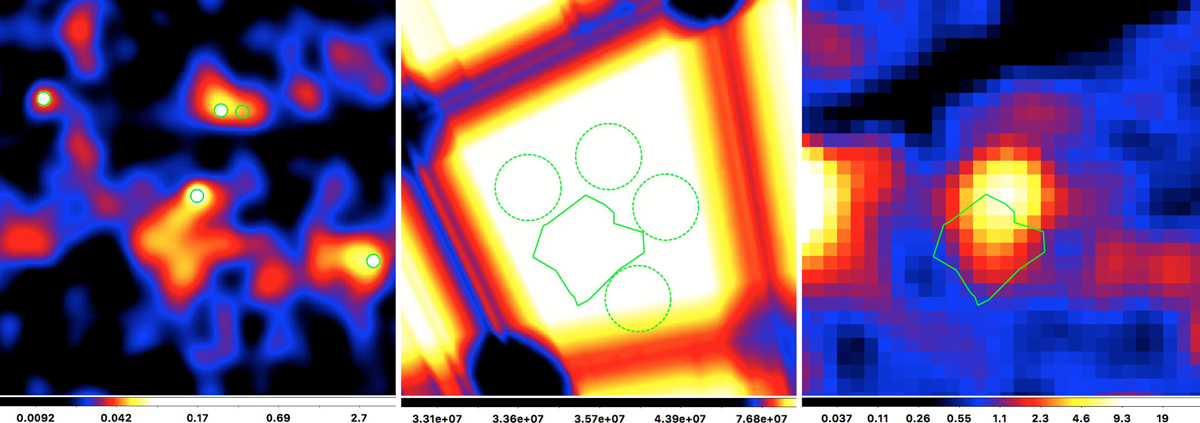
Left panel: Chandra 0.5–2 keV image (2′ × 2′), smoothed with csmooth (see text) and centered at the QSO position. North is up and east is to the left. Green circles mark point-like sources X-ray detected in the soft band. Units on the colorbar are counts per pixel. Central panel: 2′ × 2′ image of the exposure map computed at 1.4 keV and centered at the QSO position. The green 460 arcsec2 region is the one used to extract the net counts of the diffuse emission southward on the QSO in the un-smoothed image, and it lays in the most sensitive peak of the exposure map. The four green dashed circles are the regions used to extract the background. Units on the colorbar are cm2 s per pixel. Right panel: XMM-Newton-pn image in the 0.5–2 keV band (2′ × 2′), centered at the QSO position. Units on the colorbar are counts per pixel.
Current usage metrics show cumulative count of Article Views (full-text article views including HTML views, PDF and ePub downloads, according to the available data) and Abstracts Views on Vision4Press platform.
Data correspond to usage on the plateform after 2015. The current usage metrics is available 48-96 hours after online publication and is updated daily on week days.
Initial download of the metrics may take a while.