Fig. 5.
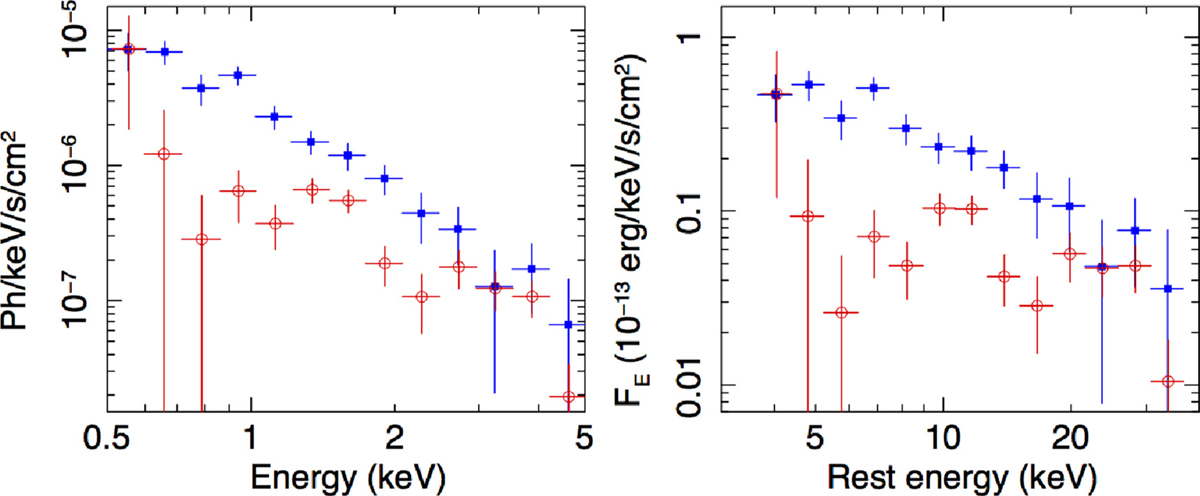
Comparison between the 2003 XMM-Newton (in blue) and 2017 Chandra (in red) spectrum of SDSS J1030 + 0524. Both spectra have been corrected for the effective response. The XMM-Newton spectrum is the average of the three EPIC cameras (with S/N weighting). The left panel shows the observed-frame spectra, while the right panel shows the rest-frame one.
Current usage metrics show cumulative count of Article Views (full-text article views including HTML views, PDF and ePub downloads, according to the available data) and Abstracts Views on Vision4Press platform.
Data correspond to usage on the plateform after 2015. The current usage metrics is available 48-96 hours after online publication and is updated daily on week days.
Initial download of the metrics may take a while.