Fig. 8
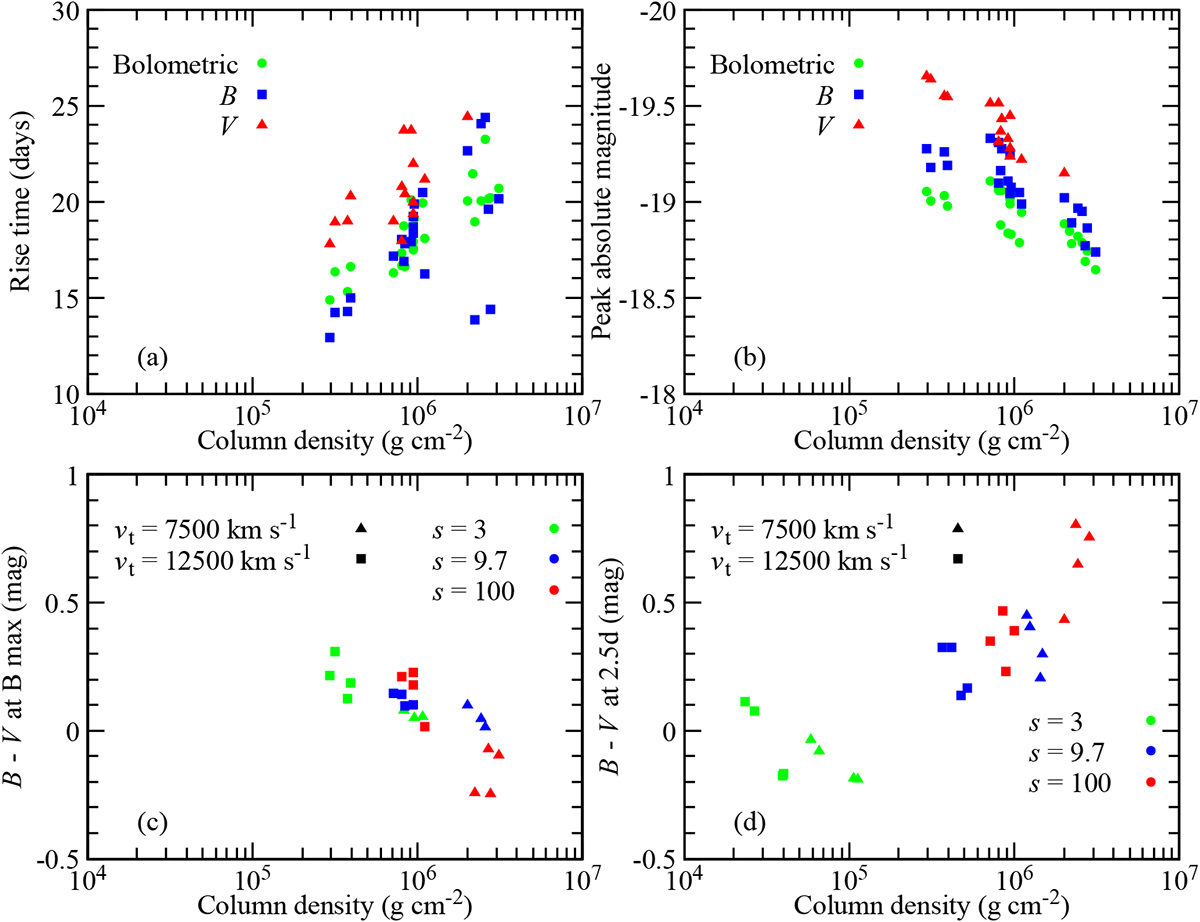
Correlations between model column density and light curve parameters. Panel a: rise time as a function of column density for bolometric, B-, and V -band light curves. Panel b: peak absolute magnitude as a function of column density for bolometric, B-, and V -band light curves. Panel c: B−V colour at time of B-band maximum. Panel d: B−V colour at 2.5 d after explosion. For panels a–c, we first find the radius that encloses 90% of the total 56Ni mass. We then integrate density over radius (at 10 000 s) outwards from this point to calculate the column density. For panel d, we follow the same procedure but instead calculate the column density above the radius at which 99% of the total 56Ni mass is enclosed. We find evidence for correlations (of varying significance) between column density, rise time, peak magnitude, and colour.
Current usage metrics show cumulative count of Article Views (full-text article views including HTML views, PDF and ePub downloads, according to the available data) and Abstracts Views on Vision4Press platform.
Data correspond to usage on the plateform after 2015. The current usage metrics is available 48-96 hours after online publication and is updated daily on week days.
Initial download of the metrics may take a while.