Fig. 5
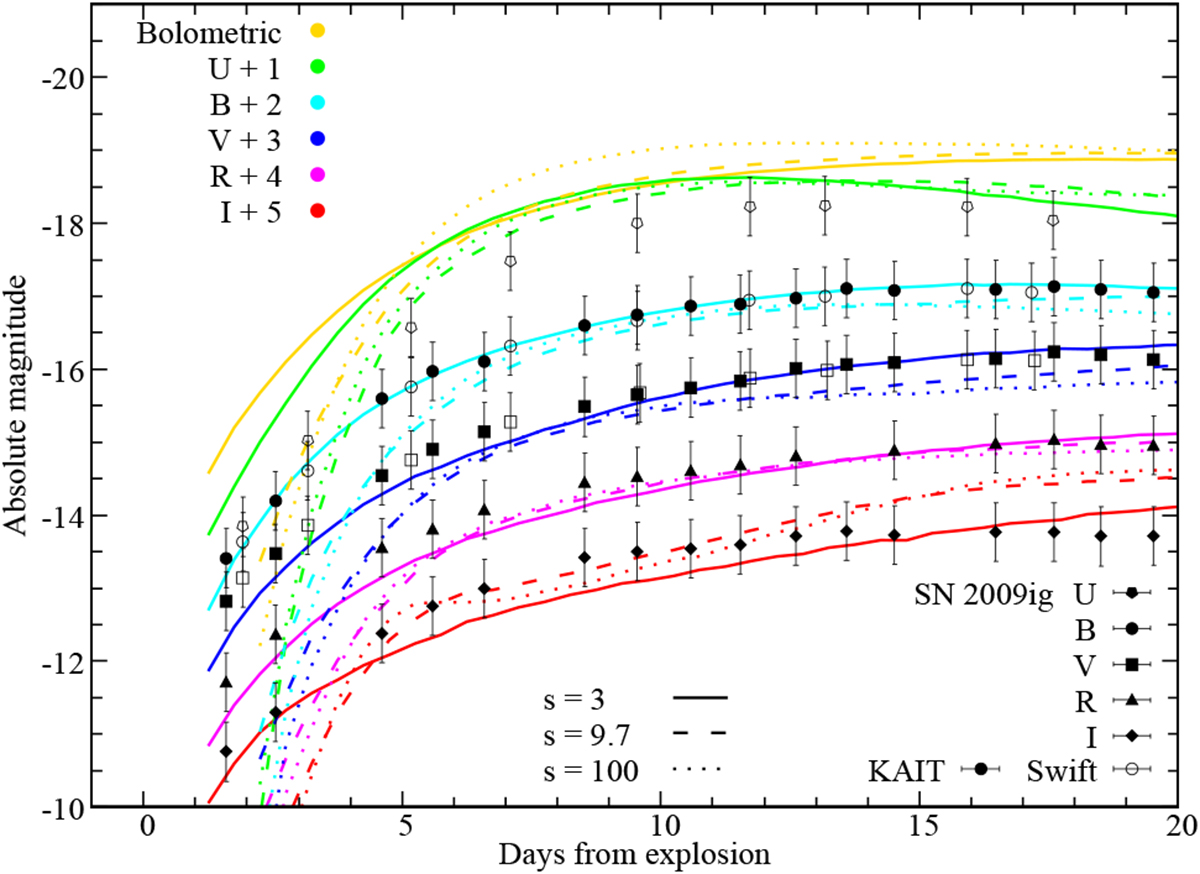
Bolometric, Swift U, and JohnsonBV RI light curves for our v7500_d0_n8 density profile, with various scaling parameters (s = 3, 9.7, and 100), and the UBV RI light curves of SN 2009ig. Light curves of SN 2009ig are shown assuming μ = 32.6 ± 0.4, negligible host extinction, and an explosion epoch of JD = 2455063.41 ± 0.08 (Foley et al. 2012). Filled points represent KAIT light curves, while unfilled points show Swift light curves. We note that for our s = 3 model tstart = 0.5 days, hence we have omitted the light curve for t < 1 days. For s = 9.7 and 100, tstart = 1.5 days, and wehave omitted the light curve for t < 2 days in these cases.
Current usage metrics show cumulative count of Article Views (full-text article views including HTML views, PDF and ePub downloads, according to the available data) and Abstracts Views on Vision4Press platform.
Data correspond to usage on the plateform after 2015. The current usage metrics is available 48-96 hours after online publication and is updated daily on week days.
Initial download of the metrics may take a while.