Fig. 9
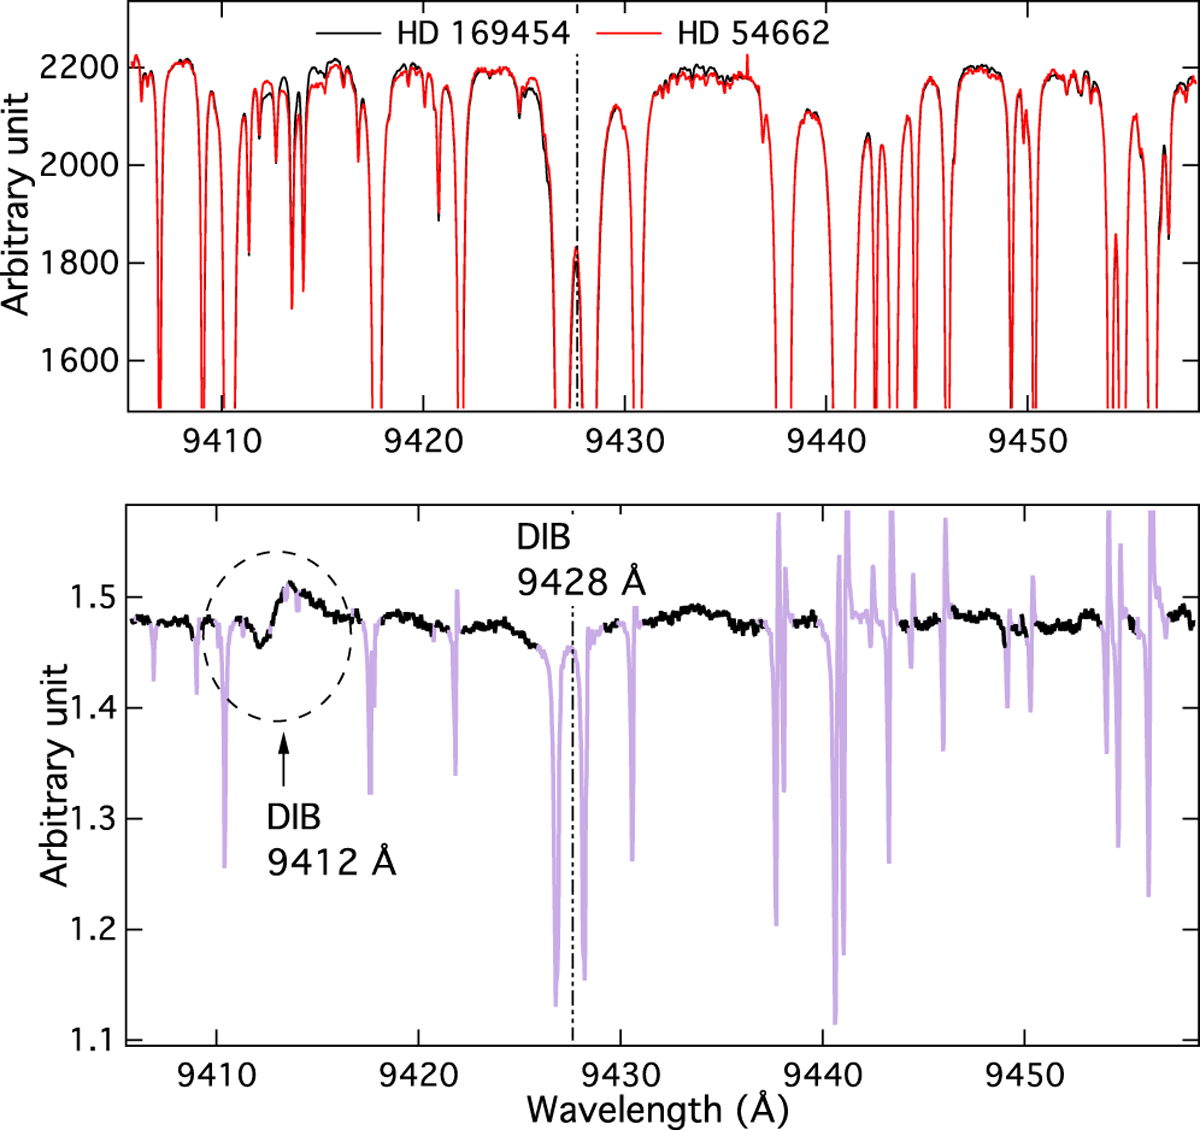
Top: same as Fig. 7, but for the two stars HD 169454 and HD 54662 (which were also shown in Fig. 8). Departures are clearly seen around the 9412 Å DIB reported by Galazutdinov et al. (2000); Cordiner et al. (2017). Very weak differences are also seen in the 9428 Å DIB region. Bottom: ratio of the two HD 169454 and HD 54662 spectra. Strong telluric residuals are present, however two additional features are apparent: a P Cygni structure around the 9412 Å DIB, resulting from the DIBs in both spectra, and a depression around 9428 Å. The dashed black vertical line indicates the expected position of the DIB based on laboratory results and corresponds to the center of the depression.
Current usage metrics show cumulative count of Article Views (full-text article views including HTML views, PDF and ePub downloads, according to the available data) and Abstracts Views on Vision4Press platform.
Data correspond to usage on the plateform after 2015. The current usage metrics is available 48-96 hours after online publication and is updated daily on week days.
Initial download of the metrics may take a while.