Fig. 6
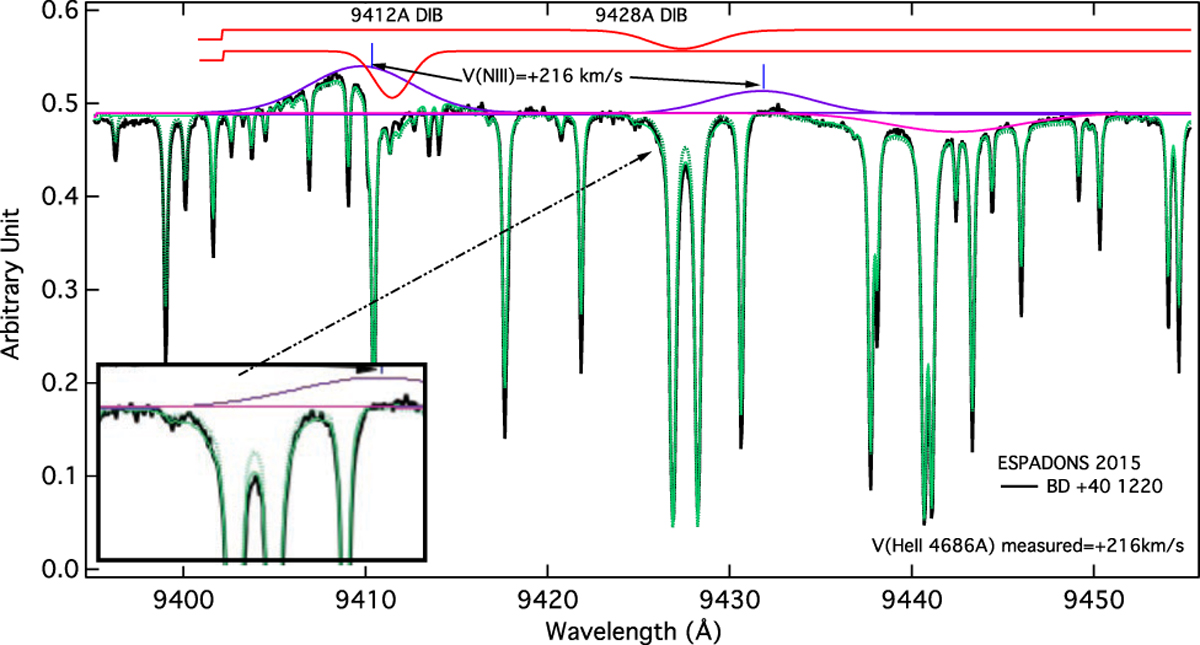
ESPaDOnS spectrum of BD+40 4220 (black line) and a simulation of the data (green line) based on a flat continuum, a convolved synthetic atmospheric water vapor profile, two Gaussian profiles representing the 9402.5and 9424.5 Å N III emission lines (violet lines), two Gaussian absorption profiles representing the two 9412 and 9428 Å DIBs present in the spectral region (red lines), a broad stellar absorption line at ~9443 Å (pink line). The stellar emission lines have been Doppler shifted in agreement with the results shown in Fig. 5. The green dashed line is the same adjustment without the 9428 Å DIB.
Current usage metrics show cumulative count of Article Views (full-text article views including HTML views, PDF and ePub downloads, according to the available data) and Abstracts Views on Vision4Press platform.
Data correspond to usage on the plateform after 2015. The current usage metrics is available 48-96 hours after online publication and is updated daily on week days.
Initial download of the metrics may take a while.