Fig. 5
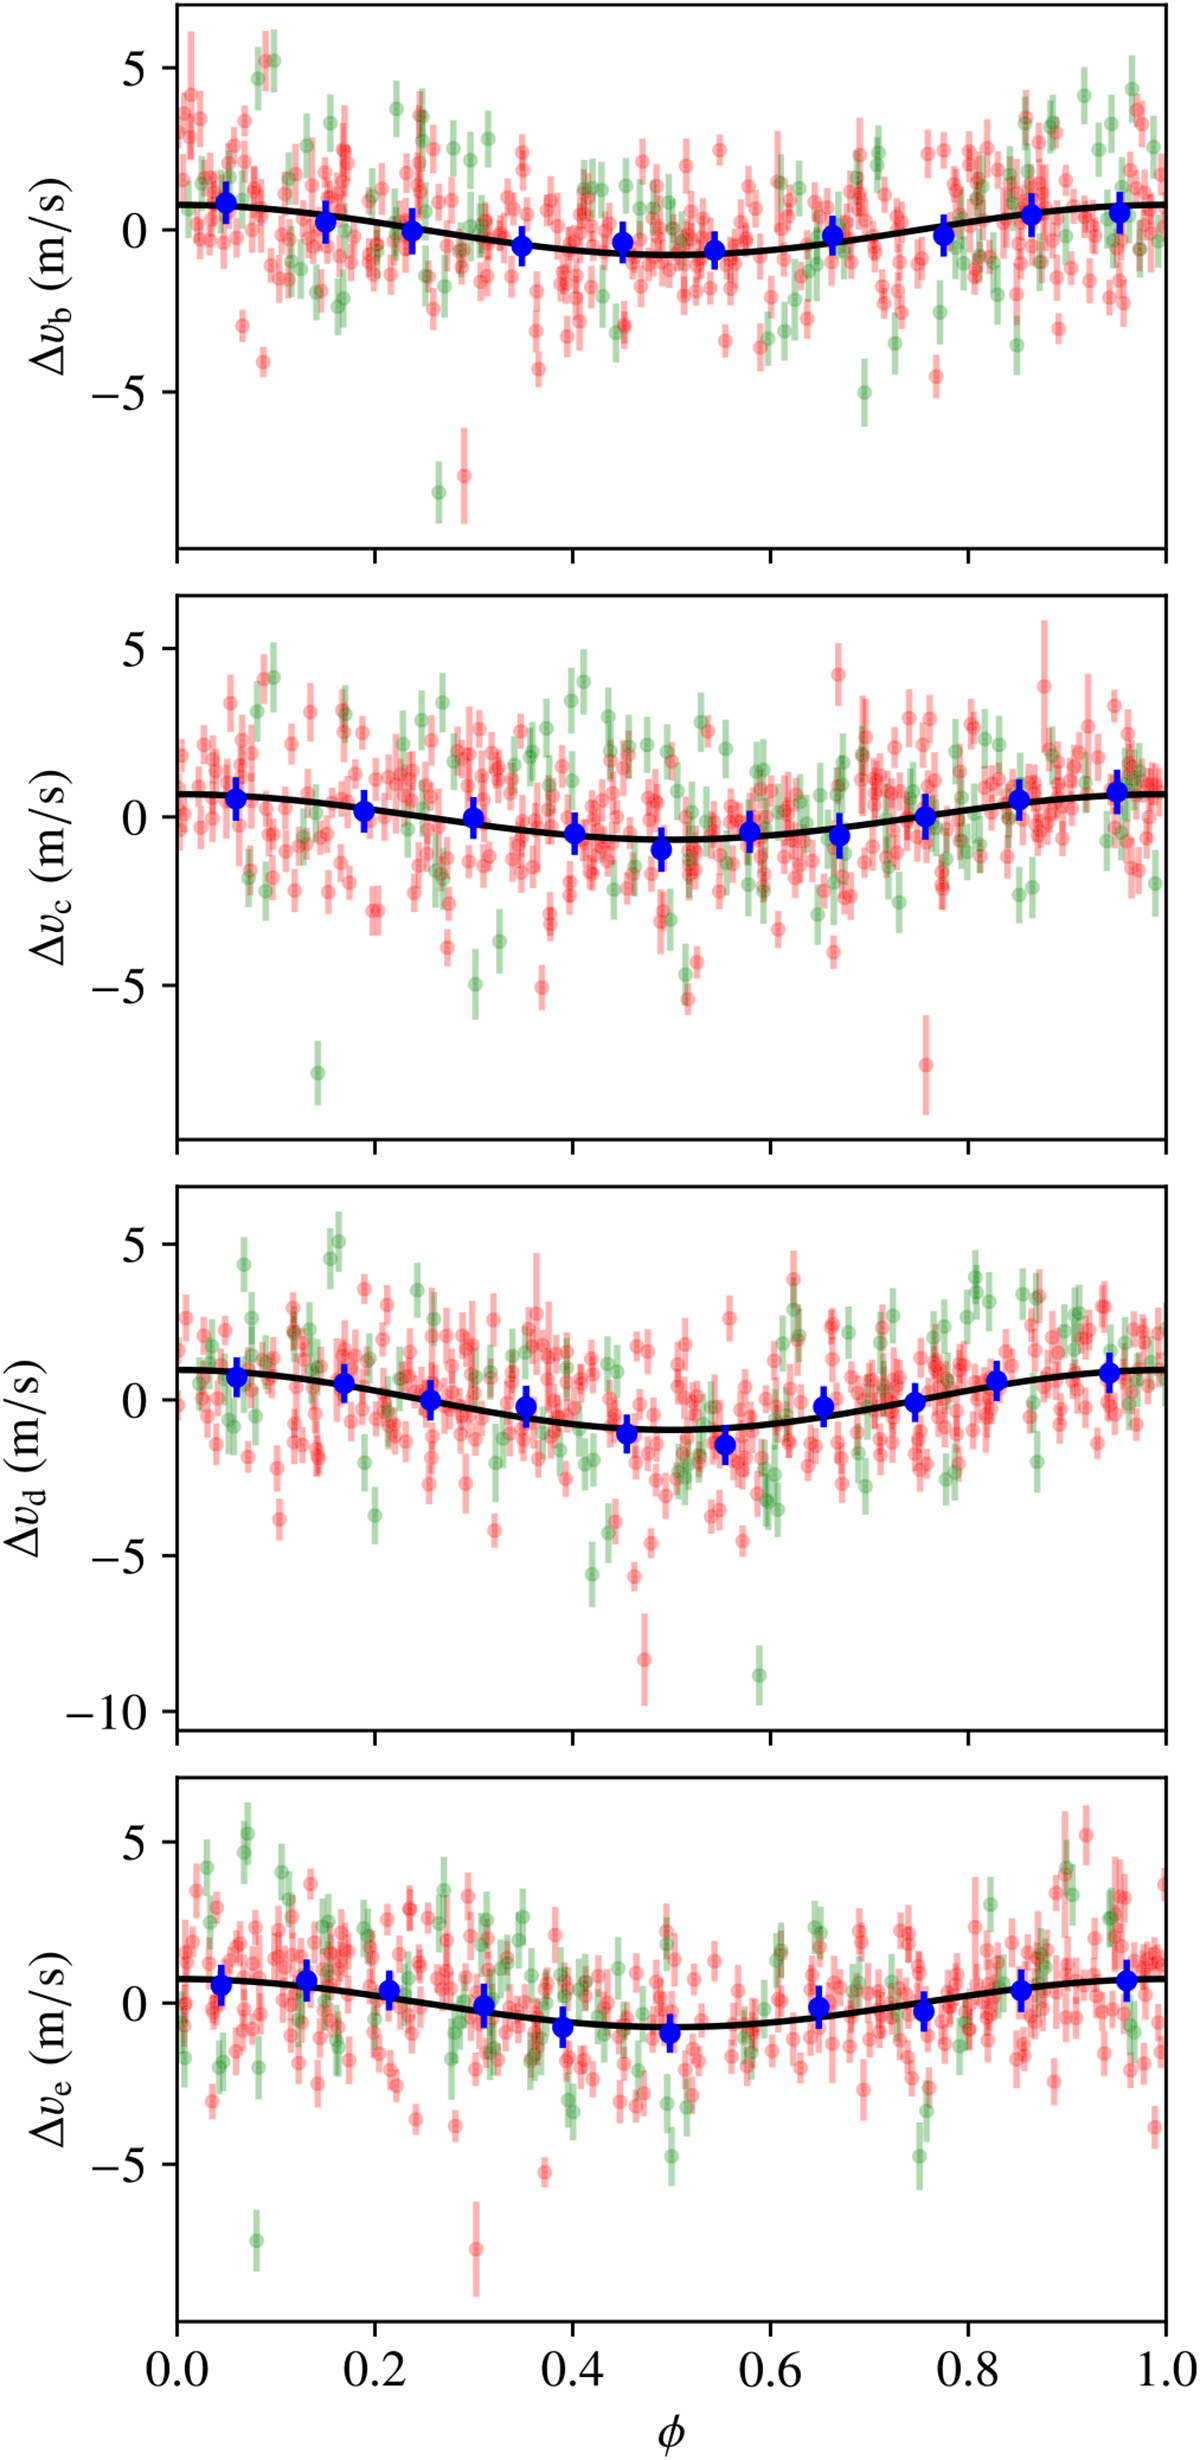
Phase-folded curve for each of the four planets obtained using the parameters of the circular ML. The black line shows the model. Red (green) dots correspond to HARPS data taken before (after) the fiber upgrade. Blue dots show the data binned in phase. For each panel, we subtracted the Keplerian signal associated with all other planets from the data, as well as the magnetic cycle component and instrumental offsets.
Current usage metrics show cumulative count of Article Views (full-text article views including HTML views, PDF and ePub downloads, according to the available data) and Abstracts Views on Vision4Press platform.
Data correspond to usage on the plateform after 2015. The current usage metrics is available 48-96 hours after online publication and is updated daily on week days.
Initial download of the metrics may take a while.