Fig. 1
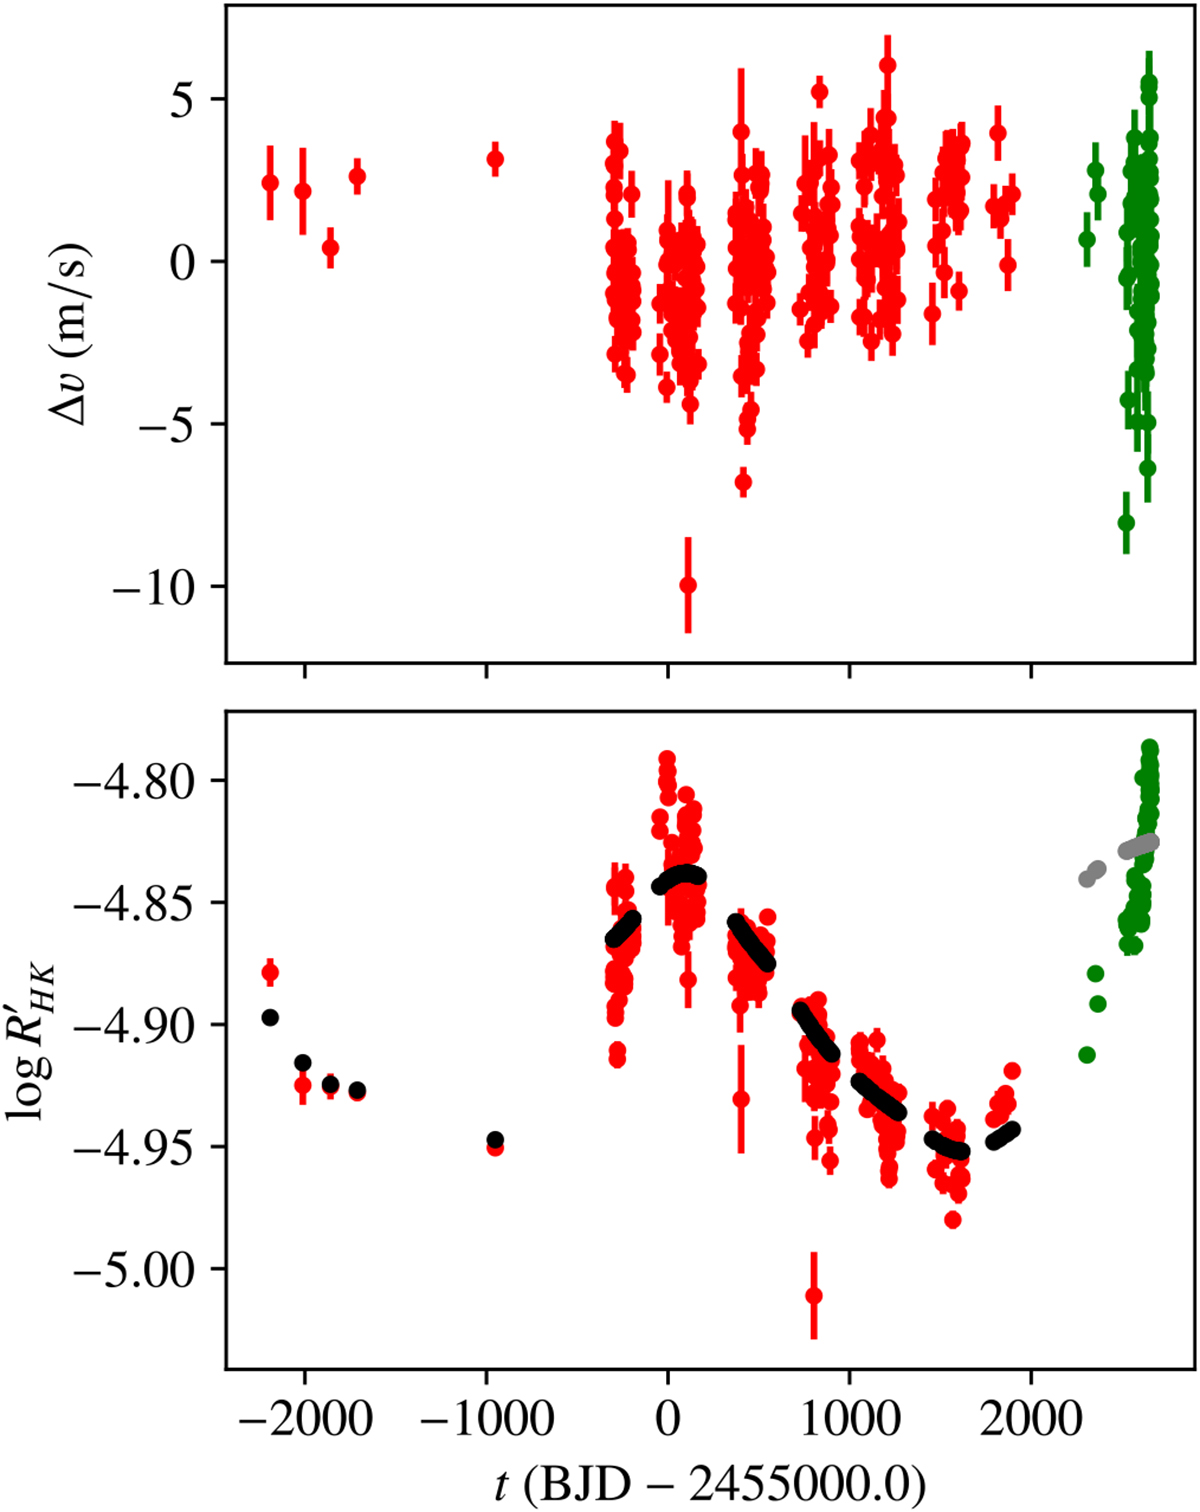
Time series of the RV (top) and the ![]() activity index (bottom). Red (green) dots correspond to HARPS data taken before (after) the fiber upgrade. The smoothed activity index, described in Sect. 3.1, is superimposed (black and gray dots) over the raw
activity index (bottom). Red (green) dots correspond to HARPS data taken before (after) the fiber upgrade. The smoothed activity index, described in Sect. 3.1, is superimposed (black and gray dots) over the raw
![]() values for comparison. We observe a long-term evolution in the RVs that is anticorrelated with the magnetic cycle (long-term evolution of the
values for comparison. We observe a long-term evolution in the RVs that is anticorrelated with the magnetic cycle (long-term evolution of the ![]() ).
).
Current usage metrics show cumulative count of Article Views (full-text article views including HTML views, PDF and ePub downloads, according to the available data) and Abstracts Views on Vision4Press platform.
Data correspond to usage on the plateform after 2015. The current usage metrics is available 48-96 hours after online publication and is updated daily on week days.
Initial download of the metrics may take a while.