Fig. 8
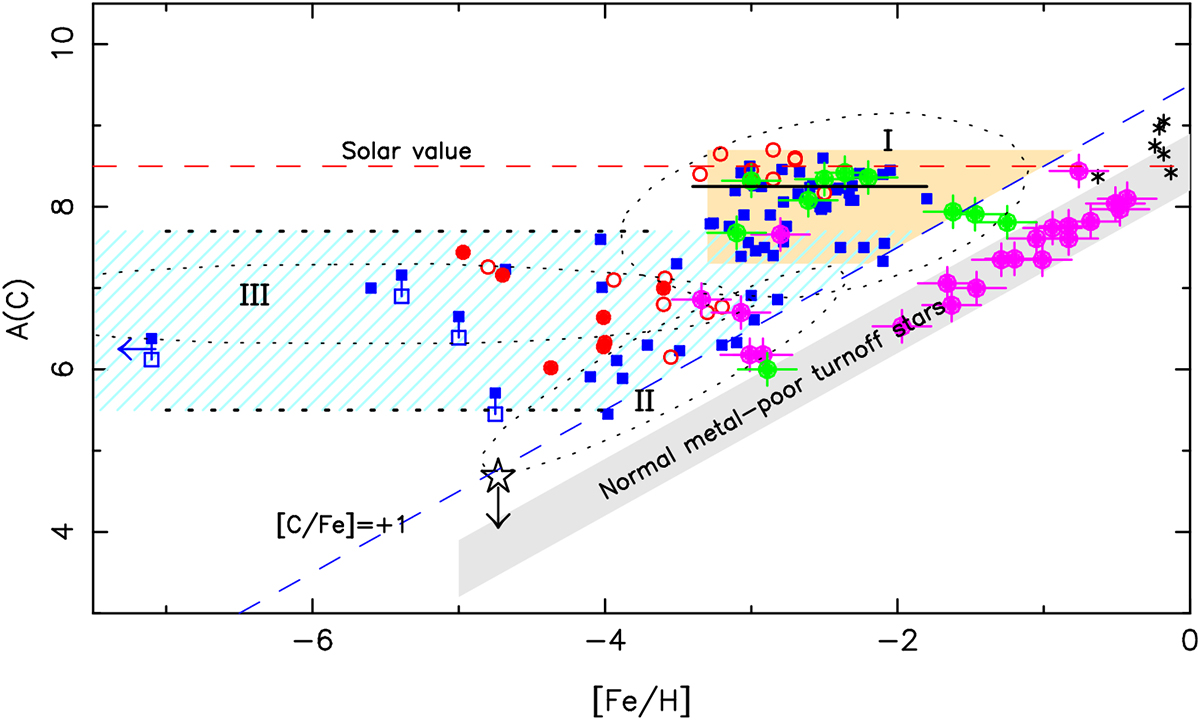
Carbon abundance vs. [Fe/H] of the sample stars (pink and green dots show stars normal and rich in Ba, respectively). Red solid dots are the stars we analysed in the TOPoS project (Bonifacio et al. 2018); the open red dots are taken from Sivarani et al. (2006); Bonifacio et al. (2009, 2015); Spite et al. (2013); Behara et al. (2010); Sivarani et al. (2004) and Caffau et al. (2013a, 2016); the black star is taken from Caffau et al. (2012). The black asterisks show known CH dwarf stars (Karinkuzhi & Goswami 2014, 2015). The blue squares show stars from the literature (Yong et al. 2013; Cohen et al. 2003, 2013; Carollo et al. 2014; Masseron et al. 2012; Jonsell et al. 2006; Thompson et al. 2008; Hansen et al. 2015, 2016; Lucatello et al. 2003; Aoki et al. 2002, 2006, 2008; Frebel et al. 2005; Li et al. 2015; Norris et al. 2007; Christlieb et al. 2004; Keller et al. 2014; Frebel et al. 2015; Roederer et al. 2014; Ivans et al. 2005). The blue and orange areas in the figure highlight the two carbon bands as defined in Bonifacio et al. (2018). The black dashed ellipses represent the regions containing the three CEMP populations according to Yoon et al. (2016).
Current usage metrics show cumulative count of Article Views (full-text article views including HTML views, PDF and ePub downloads, according to the available data) and Abstracts Views on Vision4Press platform.
Data correspond to usage on the plateform after 2015. The current usage metrics is available 48-96 hours after online publication and is updated daily on week days.
Initial download of the metrics may take a while.