Fig. 9
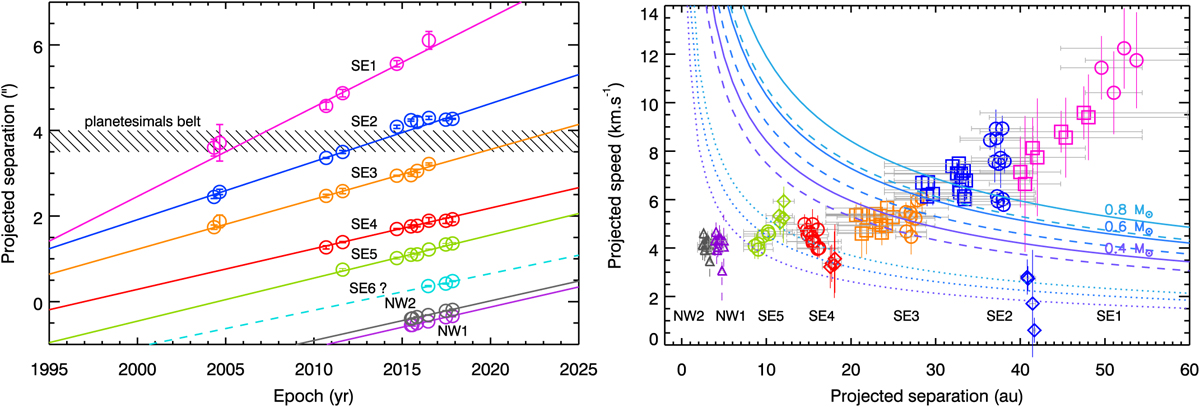
Temporal evolution of the southeastern (SE) as well as northwestern (NW) features. Left: projected separation versus time of each individual features as measured from 2004 to 2017 (circles), for all the epochs listed in Table 2. A linear trend is arbitrarily fitted to the data points. Each color identifies one specific feature. The expected location of the planetesimal belt is shown as a dashed area at stellocentric distances of 3.5″–4″. Right: projected speed vs. projected separations of each feature identified with various symbols (square, circle, and diamond) depending on the reference epoch (Apr. 2004, Aug. 2010/Jul.2011, and Aug. 2014, respectively). Gray horizontal lines correspond to the temporal baseline between two epochs for which the projected speed is evaluated. Full vertical lines stand for the error bars calculated from the uncertainties on the positions. Three stellar mass assumptions are considered: 0.4, 0.6, and 0.8 M⊙, as well as two types of orbits: circular (dotted lines) and eccentric with e = 0.9 (dashed lines), and the lower limit for unbound trajectories (full lines). The color code is the same as in the left plot.
Current usage metrics show cumulative count of Article Views (full-text article views including HTML views, PDF and ePub downloads, according to the available data) and Abstracts Views on Vision4Press platform.
Data correspond to usage on the plateform after 2015. The current usage metrics is available 48-96 hours after online publication and is updated daily on week days.
Initial download of the metrics may take a while.