Fig. 6
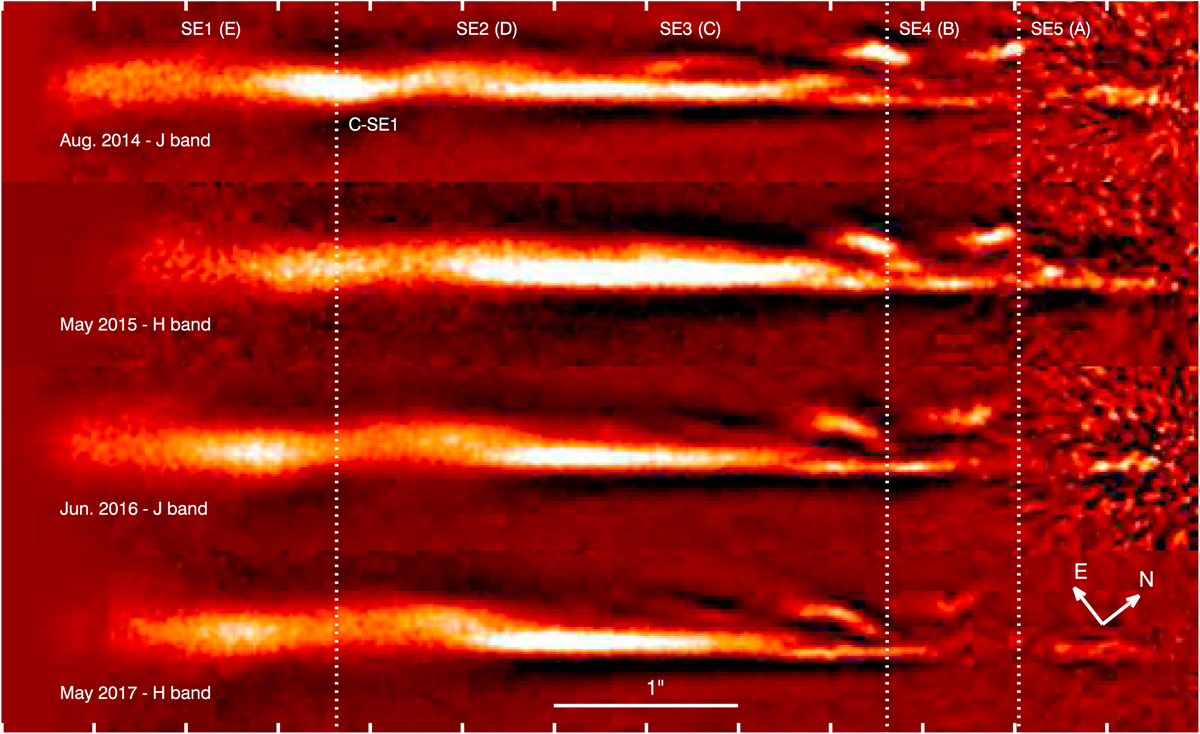
SPHERE/IRDIS total intensity images of the southeast side of the disk for the four best epochs (Aug. 2014, May 2015, Jun. 2016, and May 2017). The data are processed with the LOCI algorithm and multiplied with the stellocentric distance (to give more weight to the outer parts). The star is at the right of the image. The field of view is 6.5′′ × 1.0′′, and the intensity scale is adapted for each epoch. Vertical dotted lines are drawn to roughly locate on the first epoch (Aug. 2014) the positions of the main features (SE5 and SE4 as well as an intensity enhancement C-SE1 at ~4.7′′). The top and bottom axes are graduated every 0.5″. A corresponding animation is available online.
Current usage metrics show cumulative count of Article Views (full-text article views including HTML views, PDF and ePub downloads, according to the available data) and Abstracts Views on Vision4Press platform.
Data correspond to usage on the plateform after 2015. The current usage metrics is available 48-96 hours after online publication and is updated daily on week days.
Initial download of the metrics may take a while.