Fig. 4
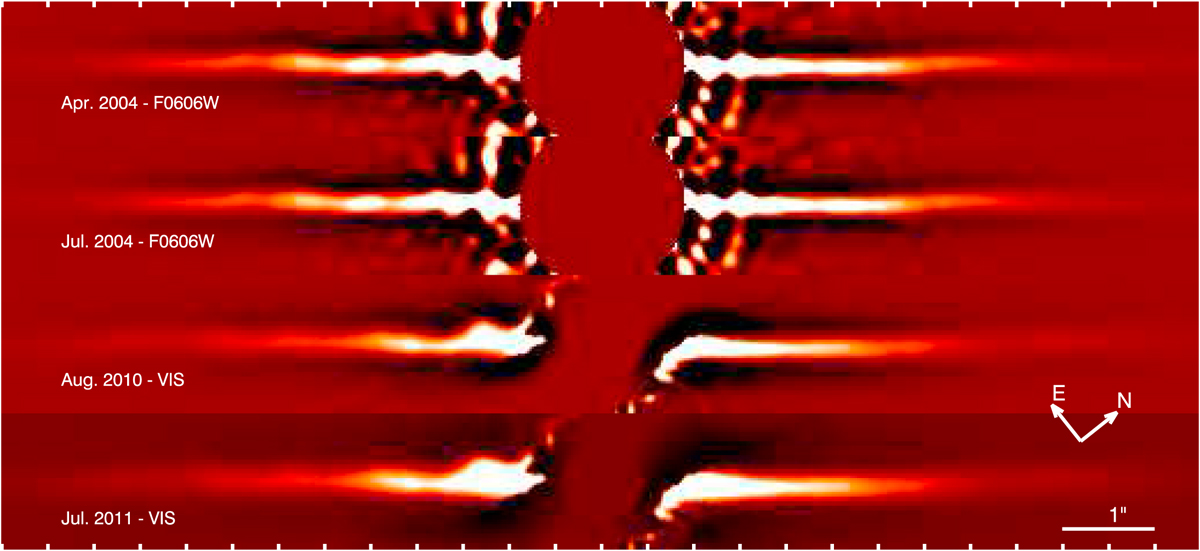
HST/ACS and HST/STIS images of the disk from 2004, 2010, and 2011, processed with high-pass filtering. The star is in thecenter of the images, and the epochs are ordered sequentially from the top to the bottom. The field of view is 13′′ × 1.5′′, and the intensity scale is adapted for each epoch. The top and bottom axes are graduated every 0.5′′.
Current usage metrics show cumulative count of Article Views (full-text article views including HTML views, PDF and ePub downloads, according to the available data) and Abstracts Views on Vision4Press platform.
Data correspond to usage on the plateform after 2015. The current usage metrics is available 48-96 hours after online publication and is updated daily on week days.
Initial download of the metrics may take a while.