Fig. 16
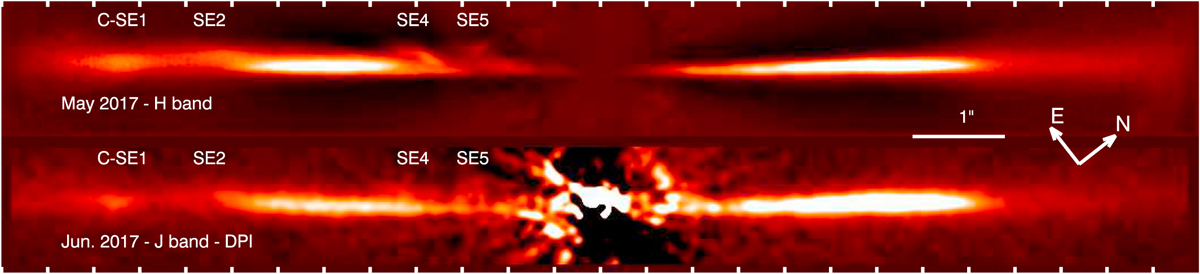
SPHERE/IRDIS images of the disk in May 2017 (H band) and June 2017 (J band) in total intensity (top) and in polarimetry (bottom), respectively. The star is at the center of the images. The data are smoothed with a one-pixel and two-pixel Gaussian kernel in intensity and in polarimetry, respectively. The field of view is 13′′ × 1.5′′ and the intensity scale is adapted for each epoch. The top and bottom axes are graduated every 0.5′′.
Current usage metrics show cumulative count of Article Views (full-text article views including HTML views, PDF and ePub downloads, according to the available data) and Abstracts Views on Vision4Press platform.
Data correspond to usage on the plateform after 2015. The current usage metrics is available 48-96 hours after online publication and is updated daily on week days.
Initial download of the metrics may take a while.