Fig. 1
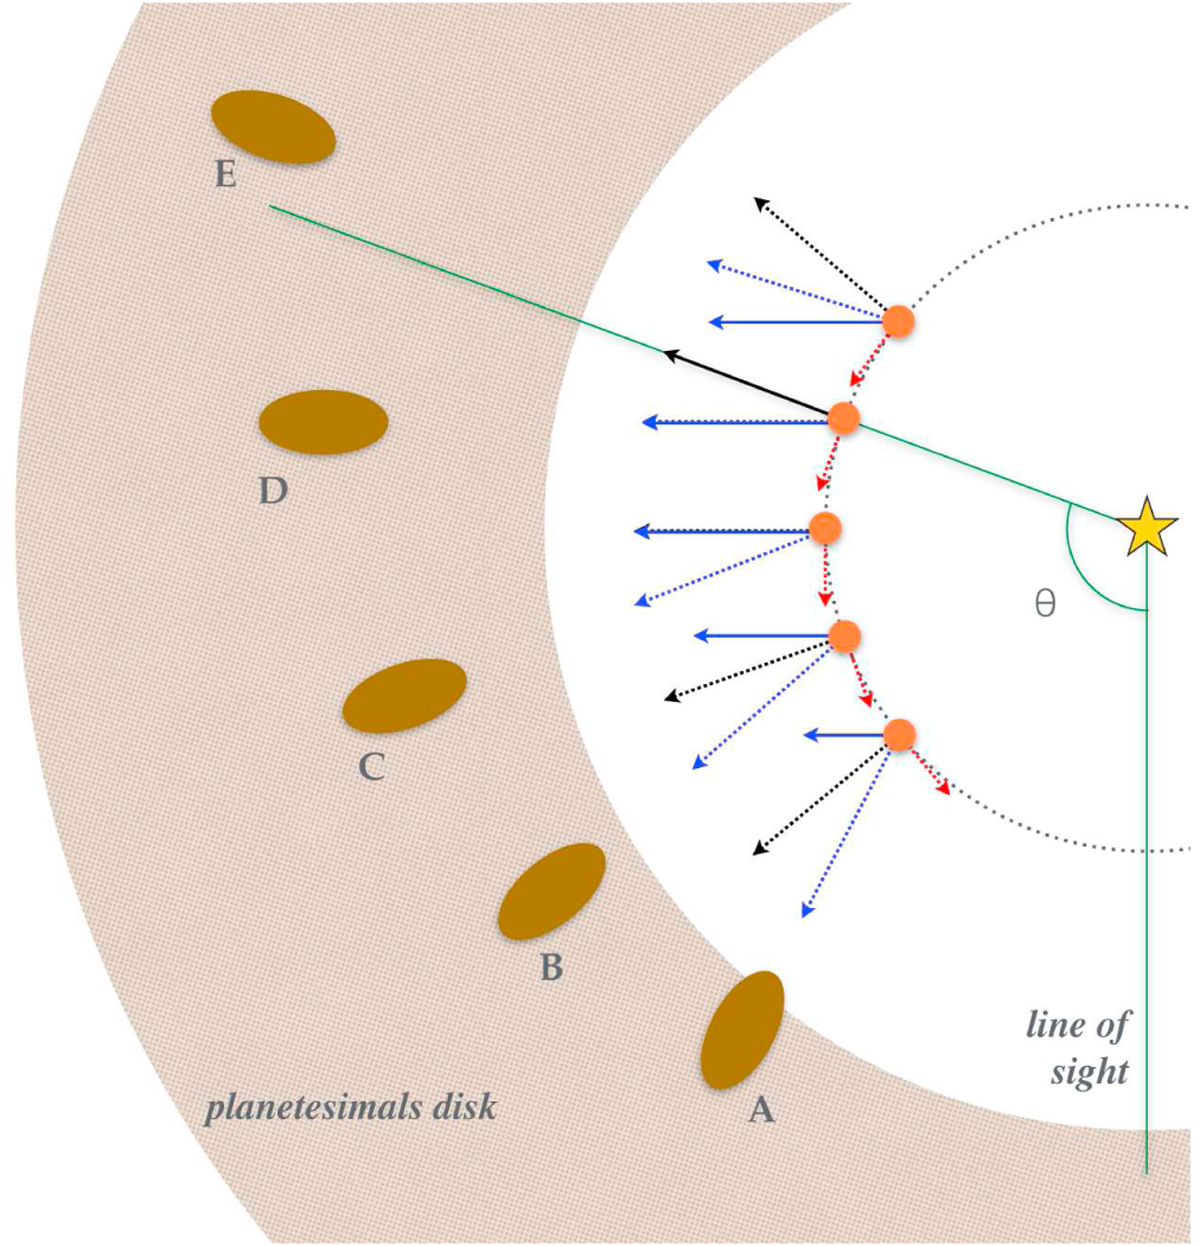
Sketch of the system seen from above assuming an orbiting parent body represented at distinct positions on its orbit (orange dot along the dotted circle). At first order, the emission of the features A–E is ruled by the combination of the parent body velocity (red dotted arrows, tangential to the orbit), and an outflow velocity produced by the stellar wind (black dotted arrows, radial to the star), the combination of which defines the velocity of the structures (blue dotted arrows). For the sake of simplicity, the amplitudes of these velocities are considered constant in time. Because of the edge-on view, the projected velocity amplitude (blue arrows) seen by the observer depends on the angle θ (green lines). The relative sizes of the velocity vectors are exaggerated for the sake of clarity. Structures are shown elongated arbitrarily.
Current usage metrics show cumulative count of Article Views (full-text article views including HTML views, PDF and ePub downloads, according to the available data) and Abstracts Views on Vision4Press platform.
Data correspond to usage on the plateform after 2015. The current usage metrics is available 48-96 hours after online publication and is updated daily on week days.
Initial download of the metrics may take a while.