Fig. 5
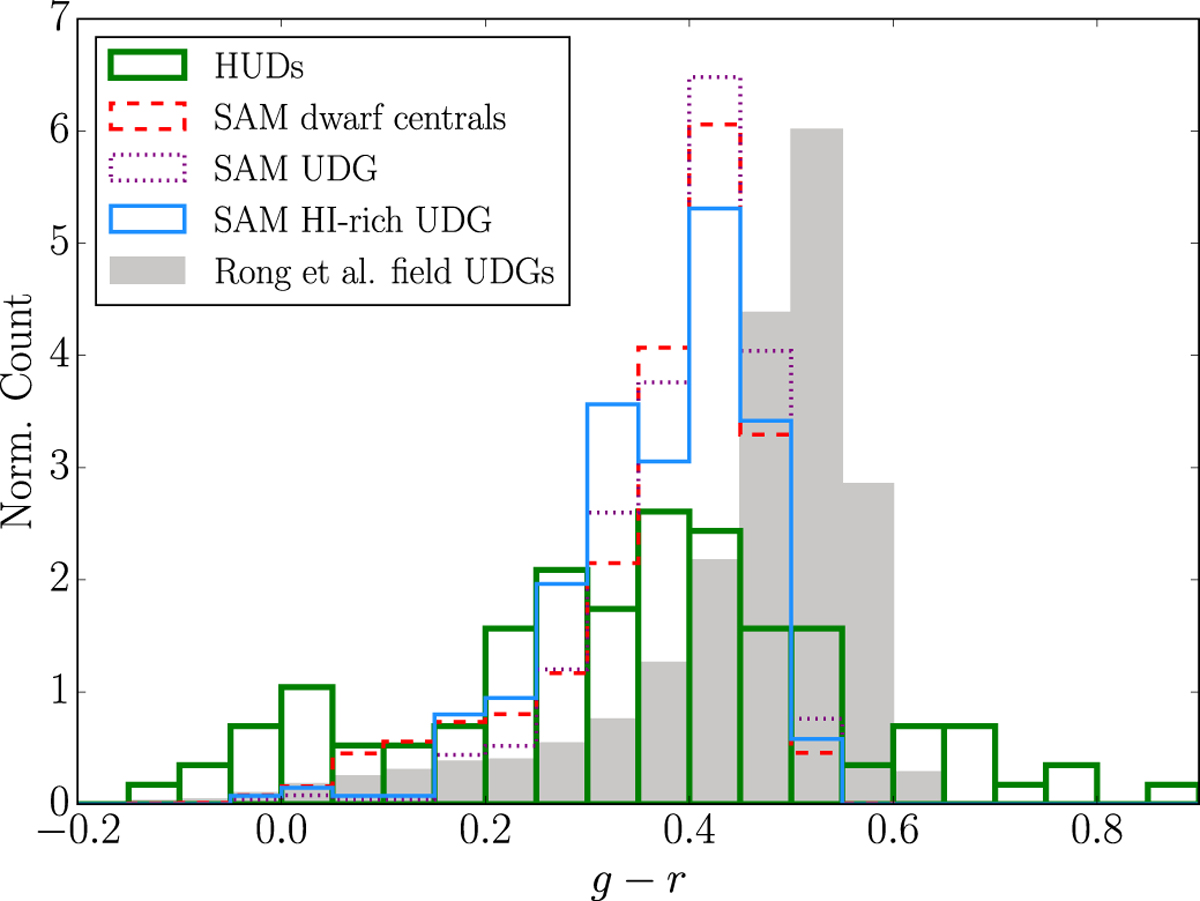
Distribution of g − r colours (AB mag) of HUDs (green outline). The dwarf (M* < 109 M⊙) centrals from the parent population of the Santa Cruz SAM are shown with the dashed red outline, the central UDGs with the dotted purple outline, and the HI-rich central UDGs with the solid blue outline. The field UDGs discussed in Rong et al. (2017) are also shown as the grey filled bars.
Current usage metrics show cumulative count of Article Views (full-text article views including HTML views, PDF and ePub downloads, according to the available data) and Abstracts Views on Vision4Press platform.
Data correspond to usage on the plateform after 2015. The current usage metrics is available 48-96 hours after online publication and is updated daily on week days.
Initial download of the metrics may take a while.