Fig. 3
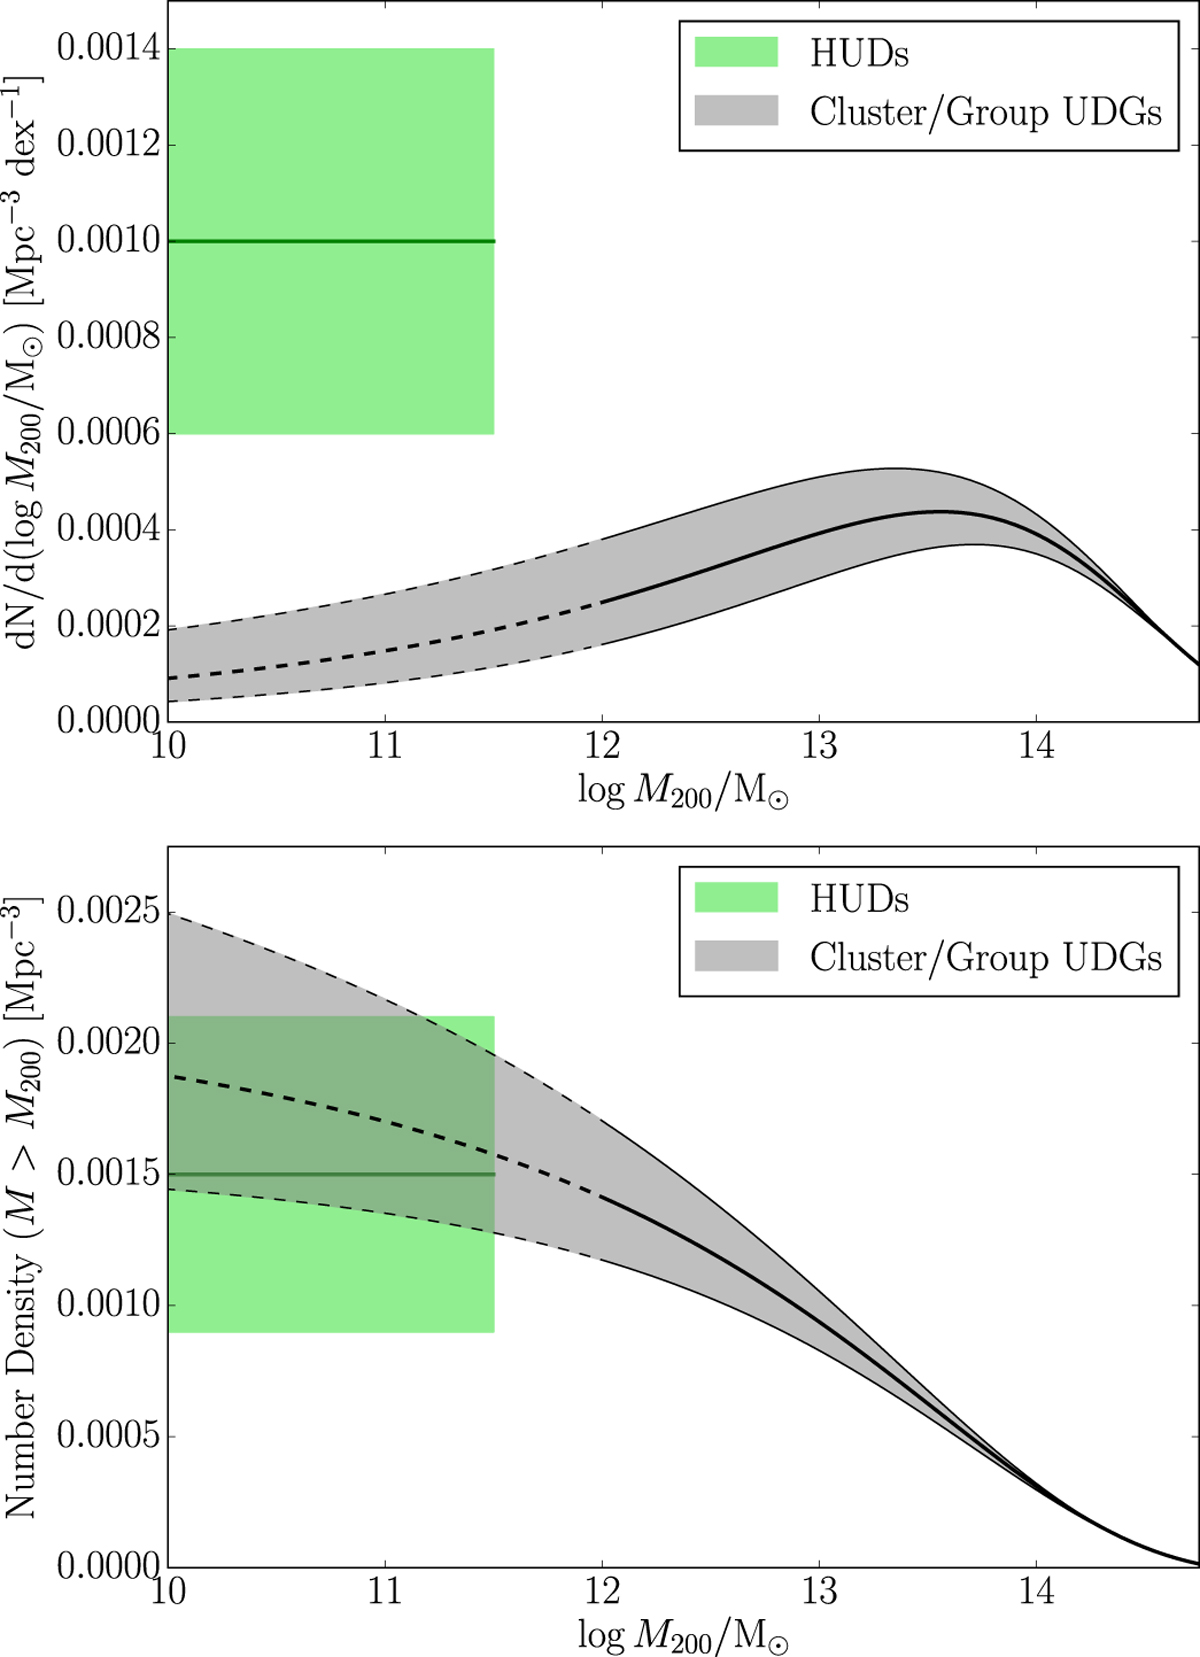
Top: number density of cluster and group UDGs (grey band and black lines) as a function of halo mass. The horizontal green band and line indicates the number density of HUDs assuming a uniform distribution across halo mass 1010 < M200∕M⊙ < 1011.5. Bottom: cumulative number density of cluster and group UDGs (grey band and black lines) in halos above a given mass. The total number density of HUDs (horizontal green band and line) is shown forcomparison. The central lines and the widths of the bands indicate the central value and 1 − σ uncertainties, respectively. The dashed black lines indicate the region over which the halo mass–UDG number relation has been extrapolated.
Current usage metrics show cumulative count of Article Views (full-text article views including HTML views, PDF and ePub downloads, according to the available data) and Abstracts Views on Vision4Press platform.
Data correspond to usage on the plateform after 2015. The current usage metrics is available 48-96 hours after online publication and is updated daily on week days.
Initial download of the metrics may take a while.