Fig. 1
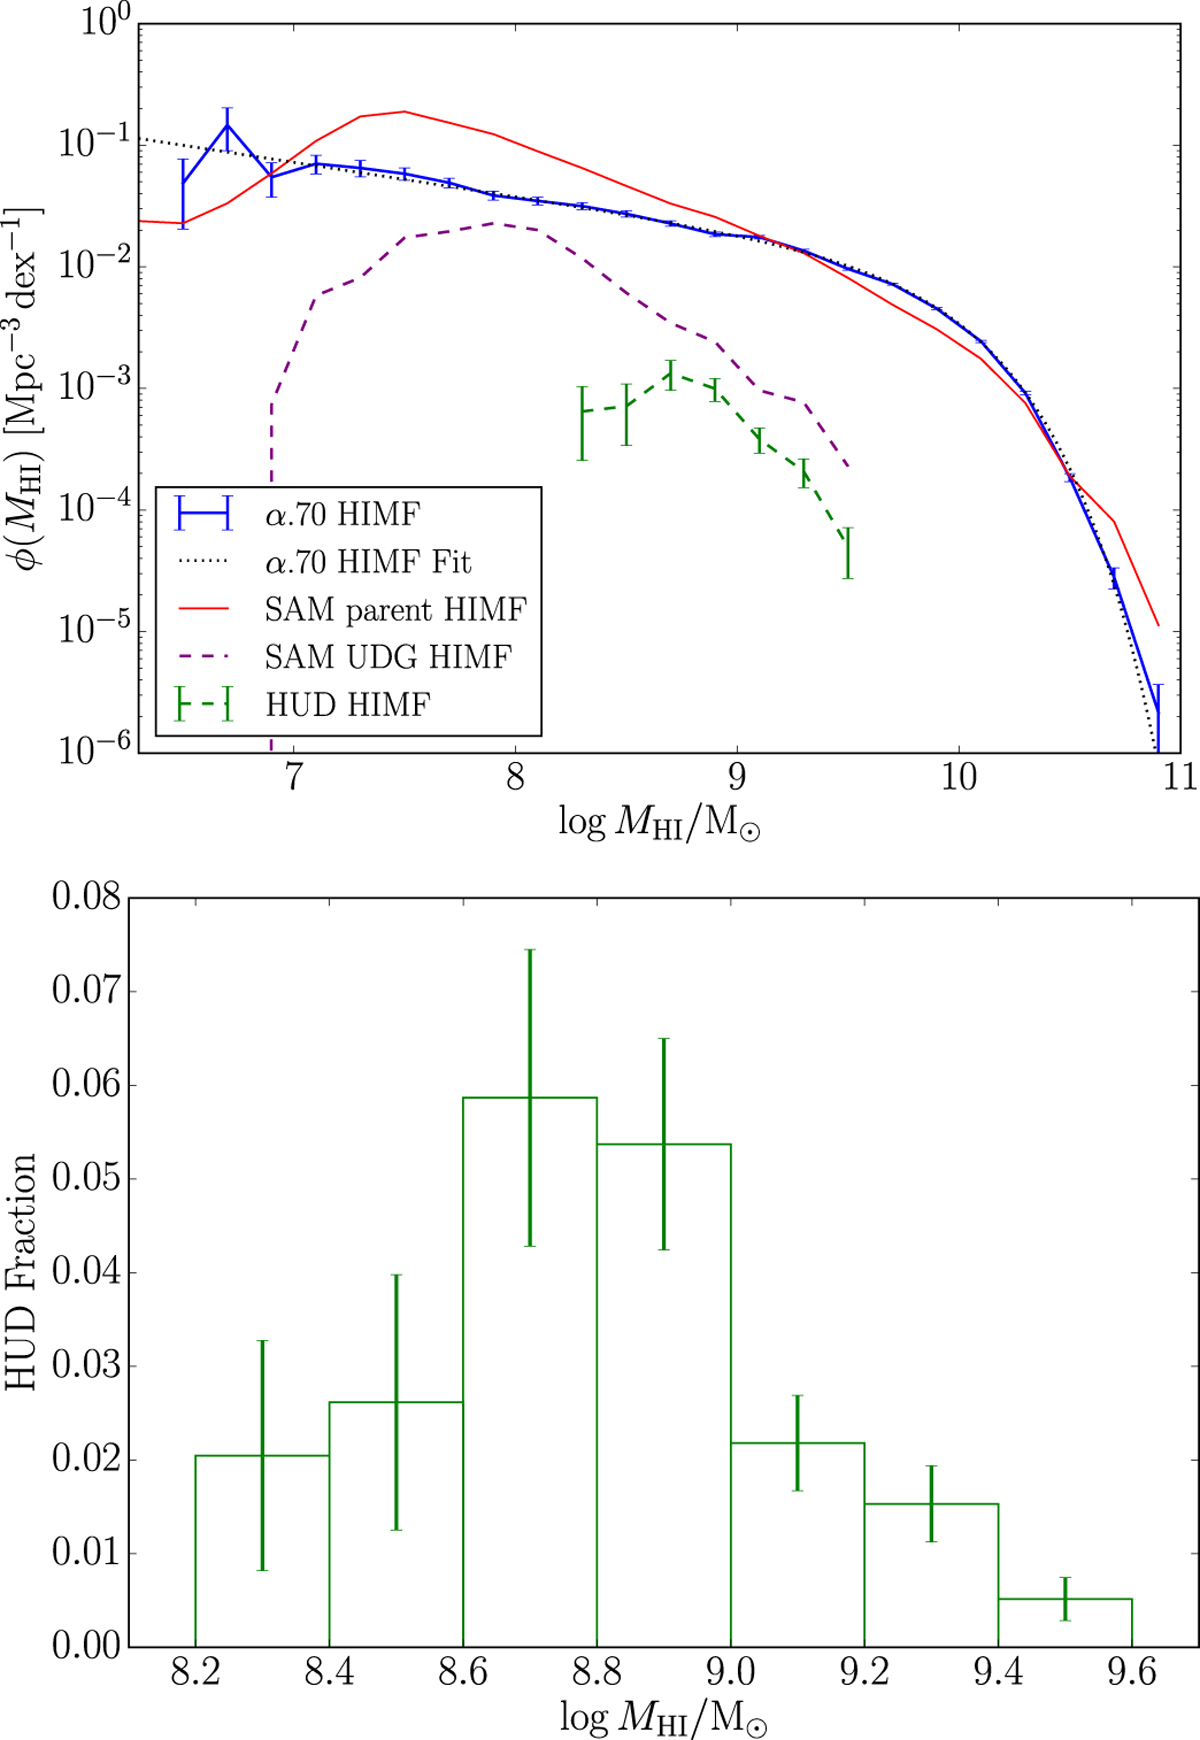
Top: HUD HIMF (dashed green line and error bars) calculated via our ratio approach (see text) compared to the full α.70 HIMF (bluesolid line and error bars) and its Schechter function fit (dotted black line). We also show for comparison the Santa Cruz SAM HIMF for all galaxies (red solid line) and central UDG HIMF (dashed purple line). Bottom: fraction of ALFALFA HI sources that are HUDs with all appropriate weightings applied. Error bars in both plots are 1 − σ and only account for Poisson uncertainties. Bins that contain only one object have been removed.
Current usage metrics show cumulative count of Article Views (full-text article views including HTML views, PDF and ePub downloads, according to the available data) and Abstracts Views on Vision4Press platform.
Data correspond to usage on the plateform after 2015. The current usage metrics is available 48-96 hours after online publication and is updated daily on week days.
Initial download of the metrics may take a while.