Fig. A.1
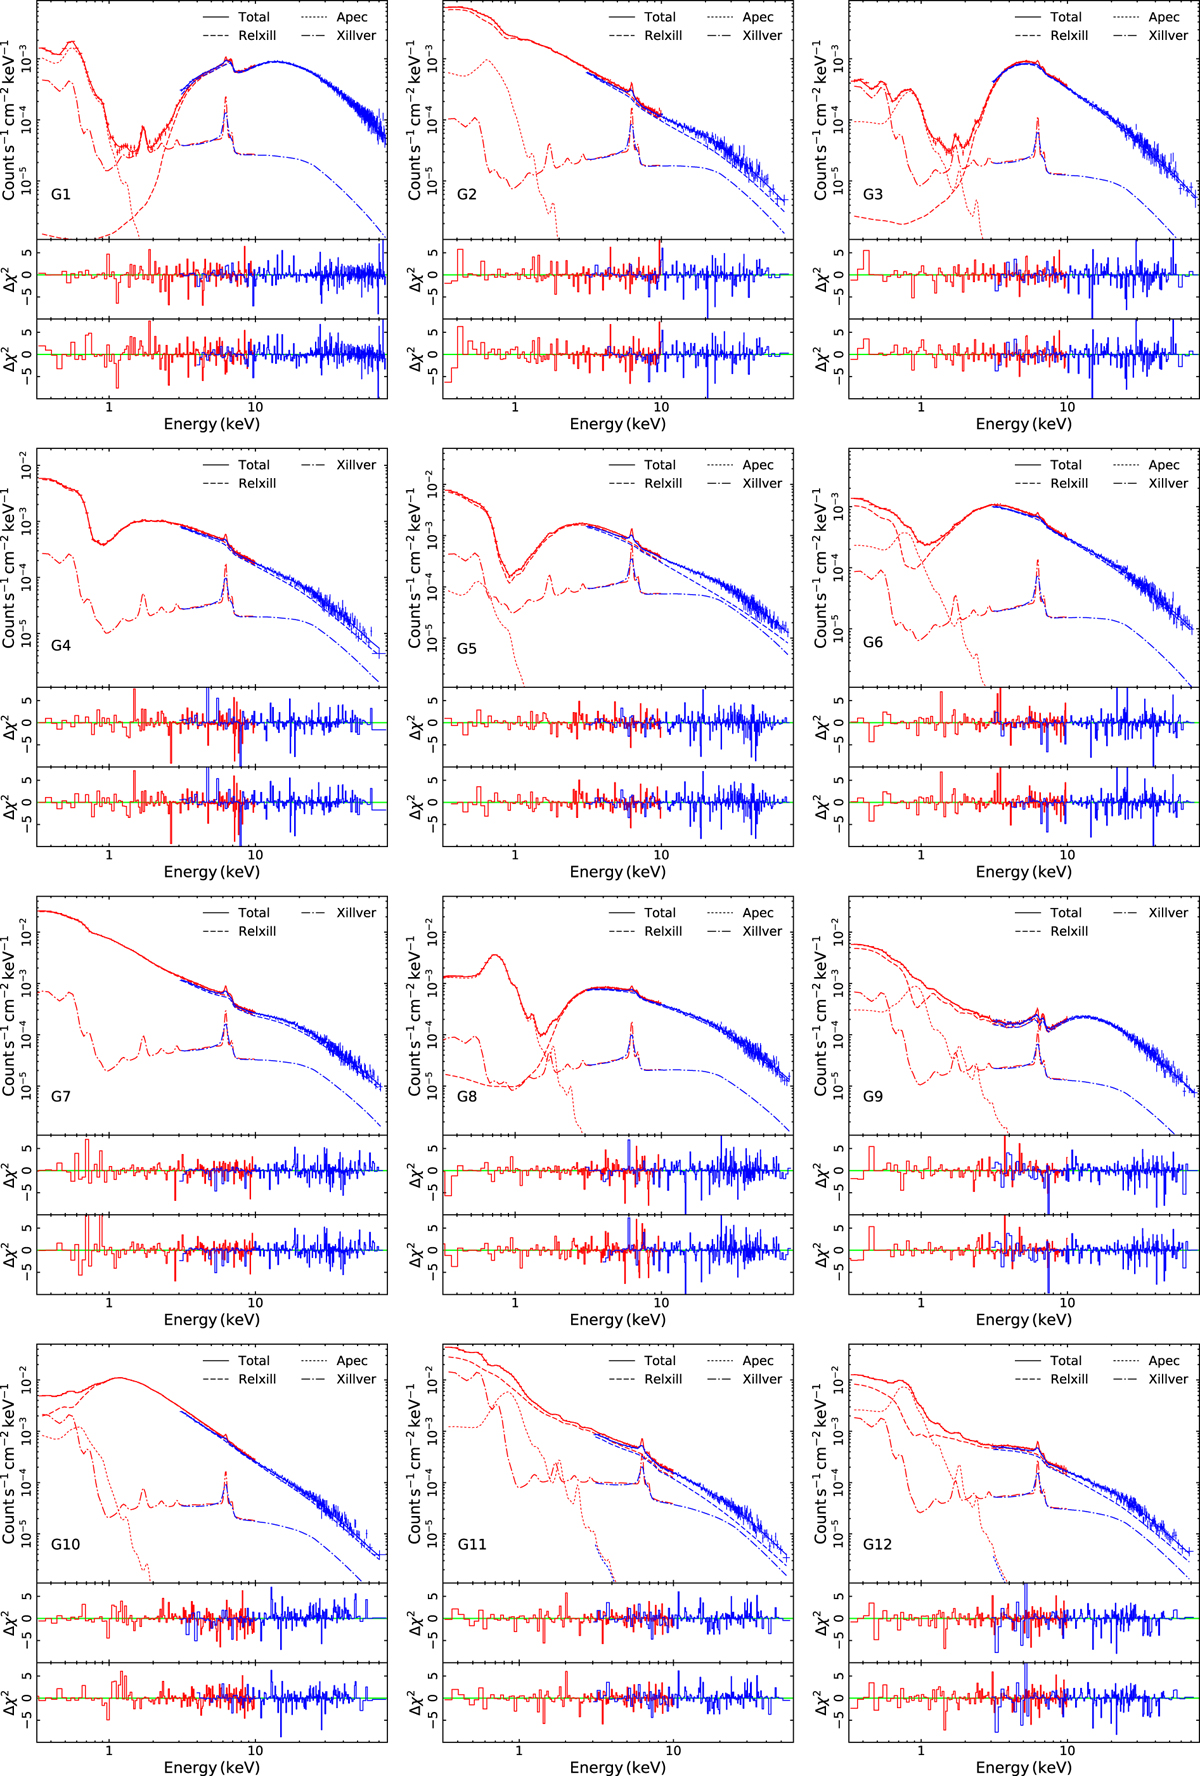
Top panel: simulated XMM-Newton (red) and NuSTAR (blue) spectra together with the various components of the theoretical model assumed. Primary emission plus ionized reflection (dashed lines), neutral reflection (dash dotted lines), and thermal emission (dotted lines) are indicated. Middle and bottom panels: the χ2 residuals obtained by the two blind fits (see Sect. 3.2 for details) are shown.
Current usage metrics show cumulative count of Article Views (full-text article views including HTML views, PDF and ePub downloads, according to the available data) and Abstracts Views on Vision4Press platform.
Data correspond to usage on the plateform after 2015. The current usage metrics is available 48-96 hours after online publication and is updated daily on week days.
Initial download of the metrics may take a while.