Fig. 8
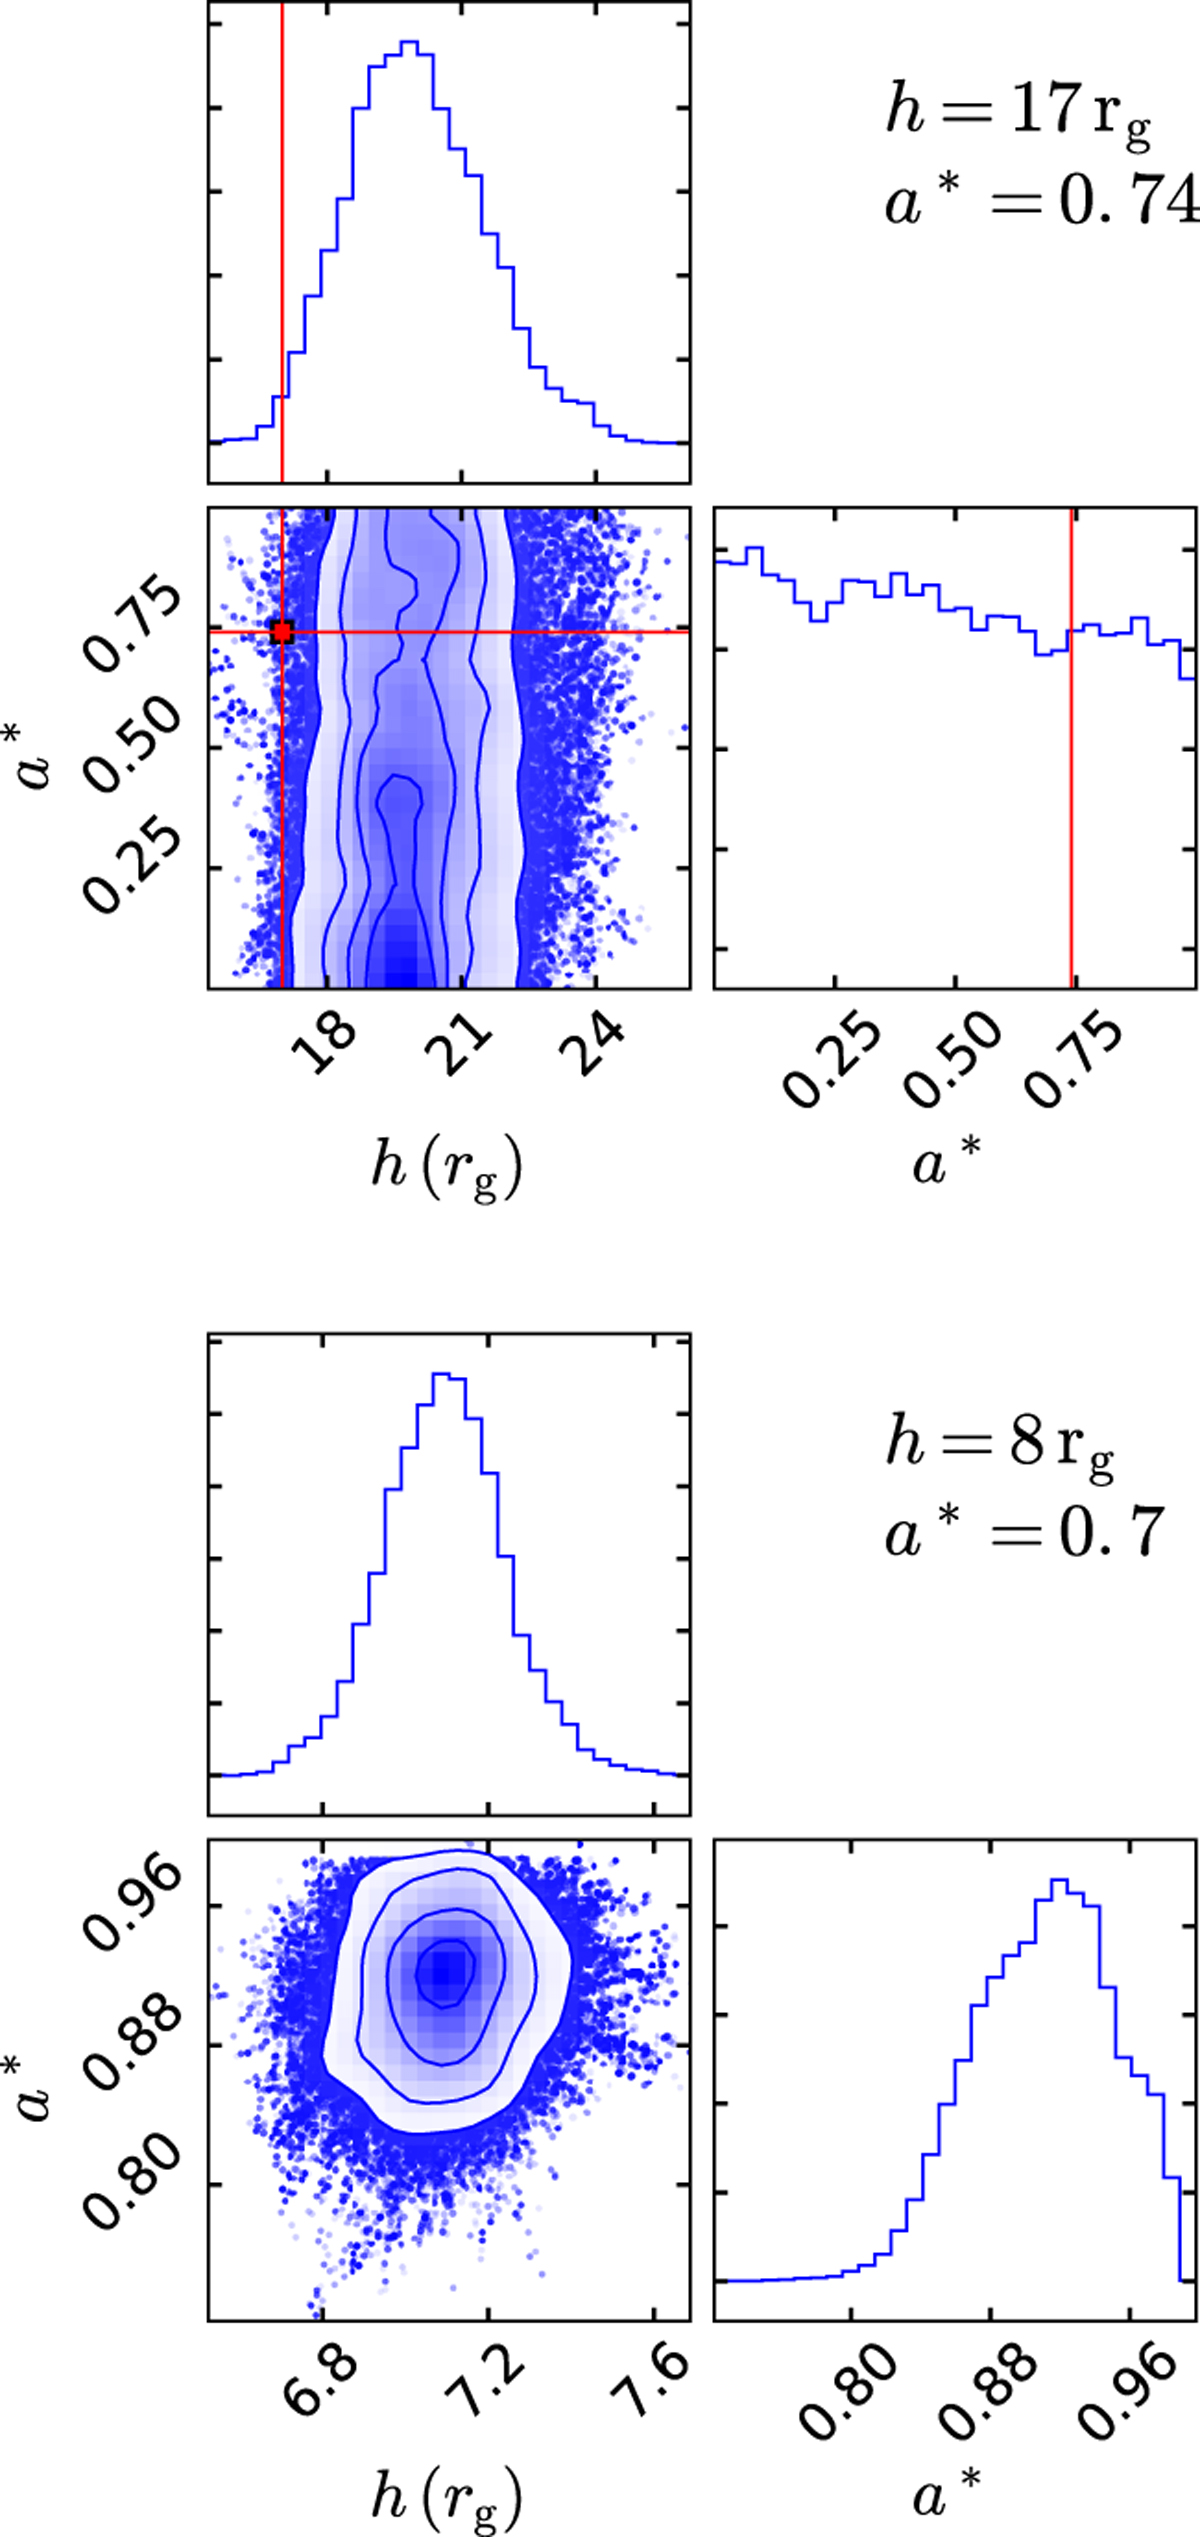
Black hole spin vs. lamp-post height contour plots obtained by the MCMC analysis obtained from the best-spectral fits of G6 (top panel) and G11 (bottom panel), performed using the Athena-WFI response files. The input spin and height values (red lines) are listed on the top right corner of each panel for the corresponding simulation.
Current usage metrics show cumulative count of Article Views (full-text article views including HTML views, PDF and ePub downloads, according to the available data) and Abstracts Views on Vision4Press platform.
Data correspond to usage on the plateform after 2015. The current usage metrics is available 48-96 hours after online publication and is updated daily on week days.
Initial download of the metrics may take a while.