Fig. 4
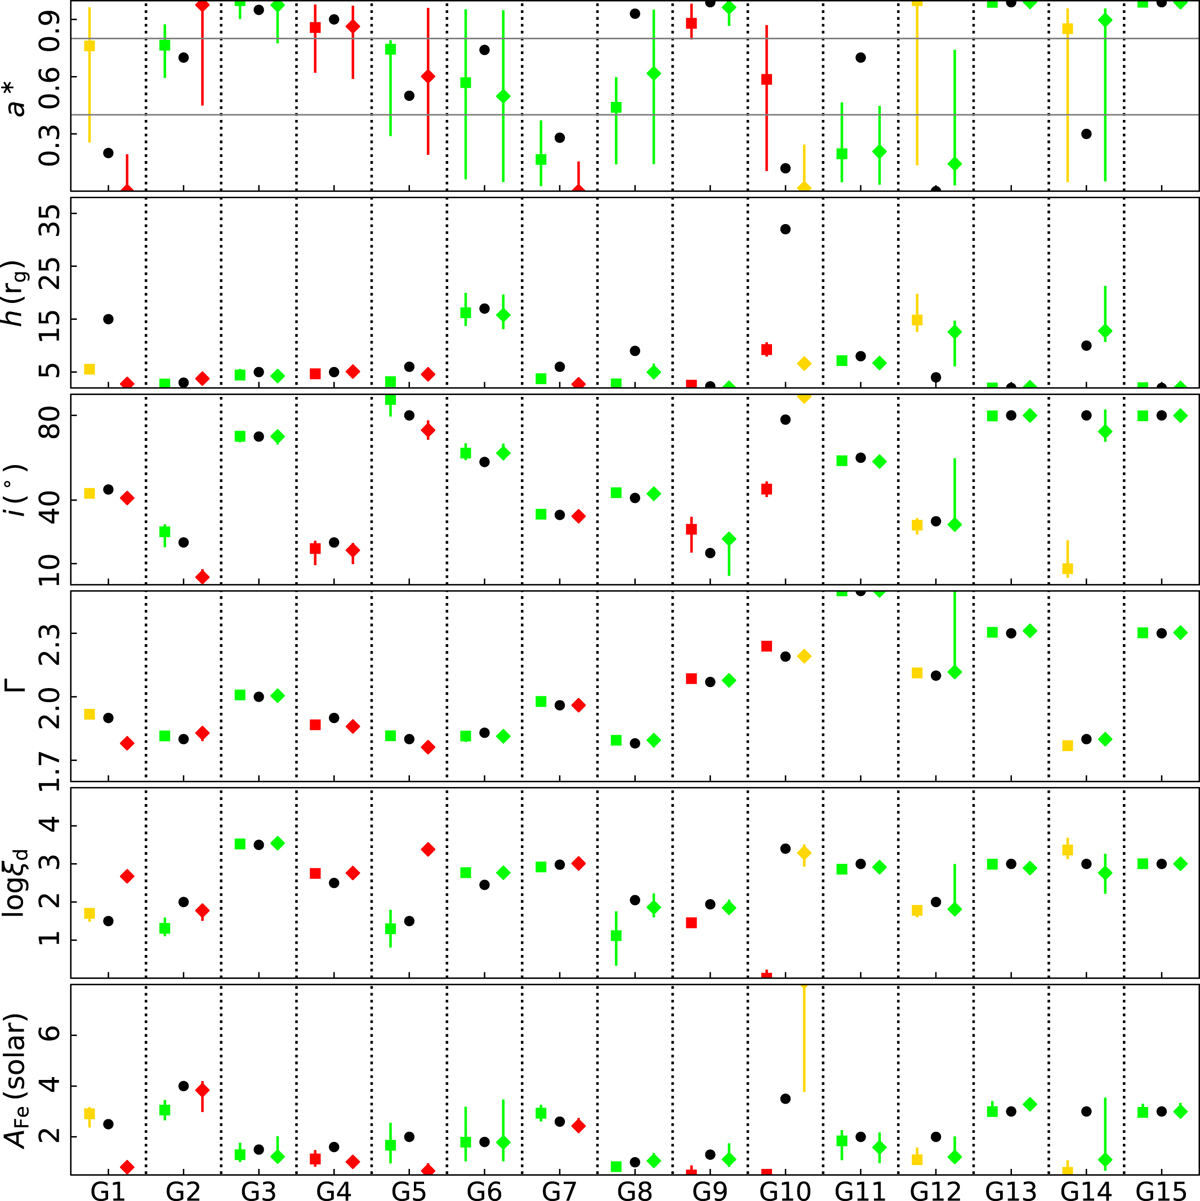
Input values (black dots) of the reflection parameters assumed for creating the various simulations (for Set G). The best-fit values obtained for the various parameters are shown as squares and diamonds for the two different realizations. The colour code refers to the quality of the fit as a whole: green for excellent, yellow for good, and red for inaccurate (see text for details). The error bars represent the 90% confidence levels obtained from the MCMC analysis.
Current usage metrics show cumulative count of Article Views (full-text article views including HTML views, PDF and ePub downloads, according to the available data) and Abstracts Views on Vision4Press platform.
Data correspond to usage on the plateform after 2015. The current usage metrics is available 48-96 hours after online publication and is updated daily on week days.
Initial download of the metrics may take a while.