Fig. 3
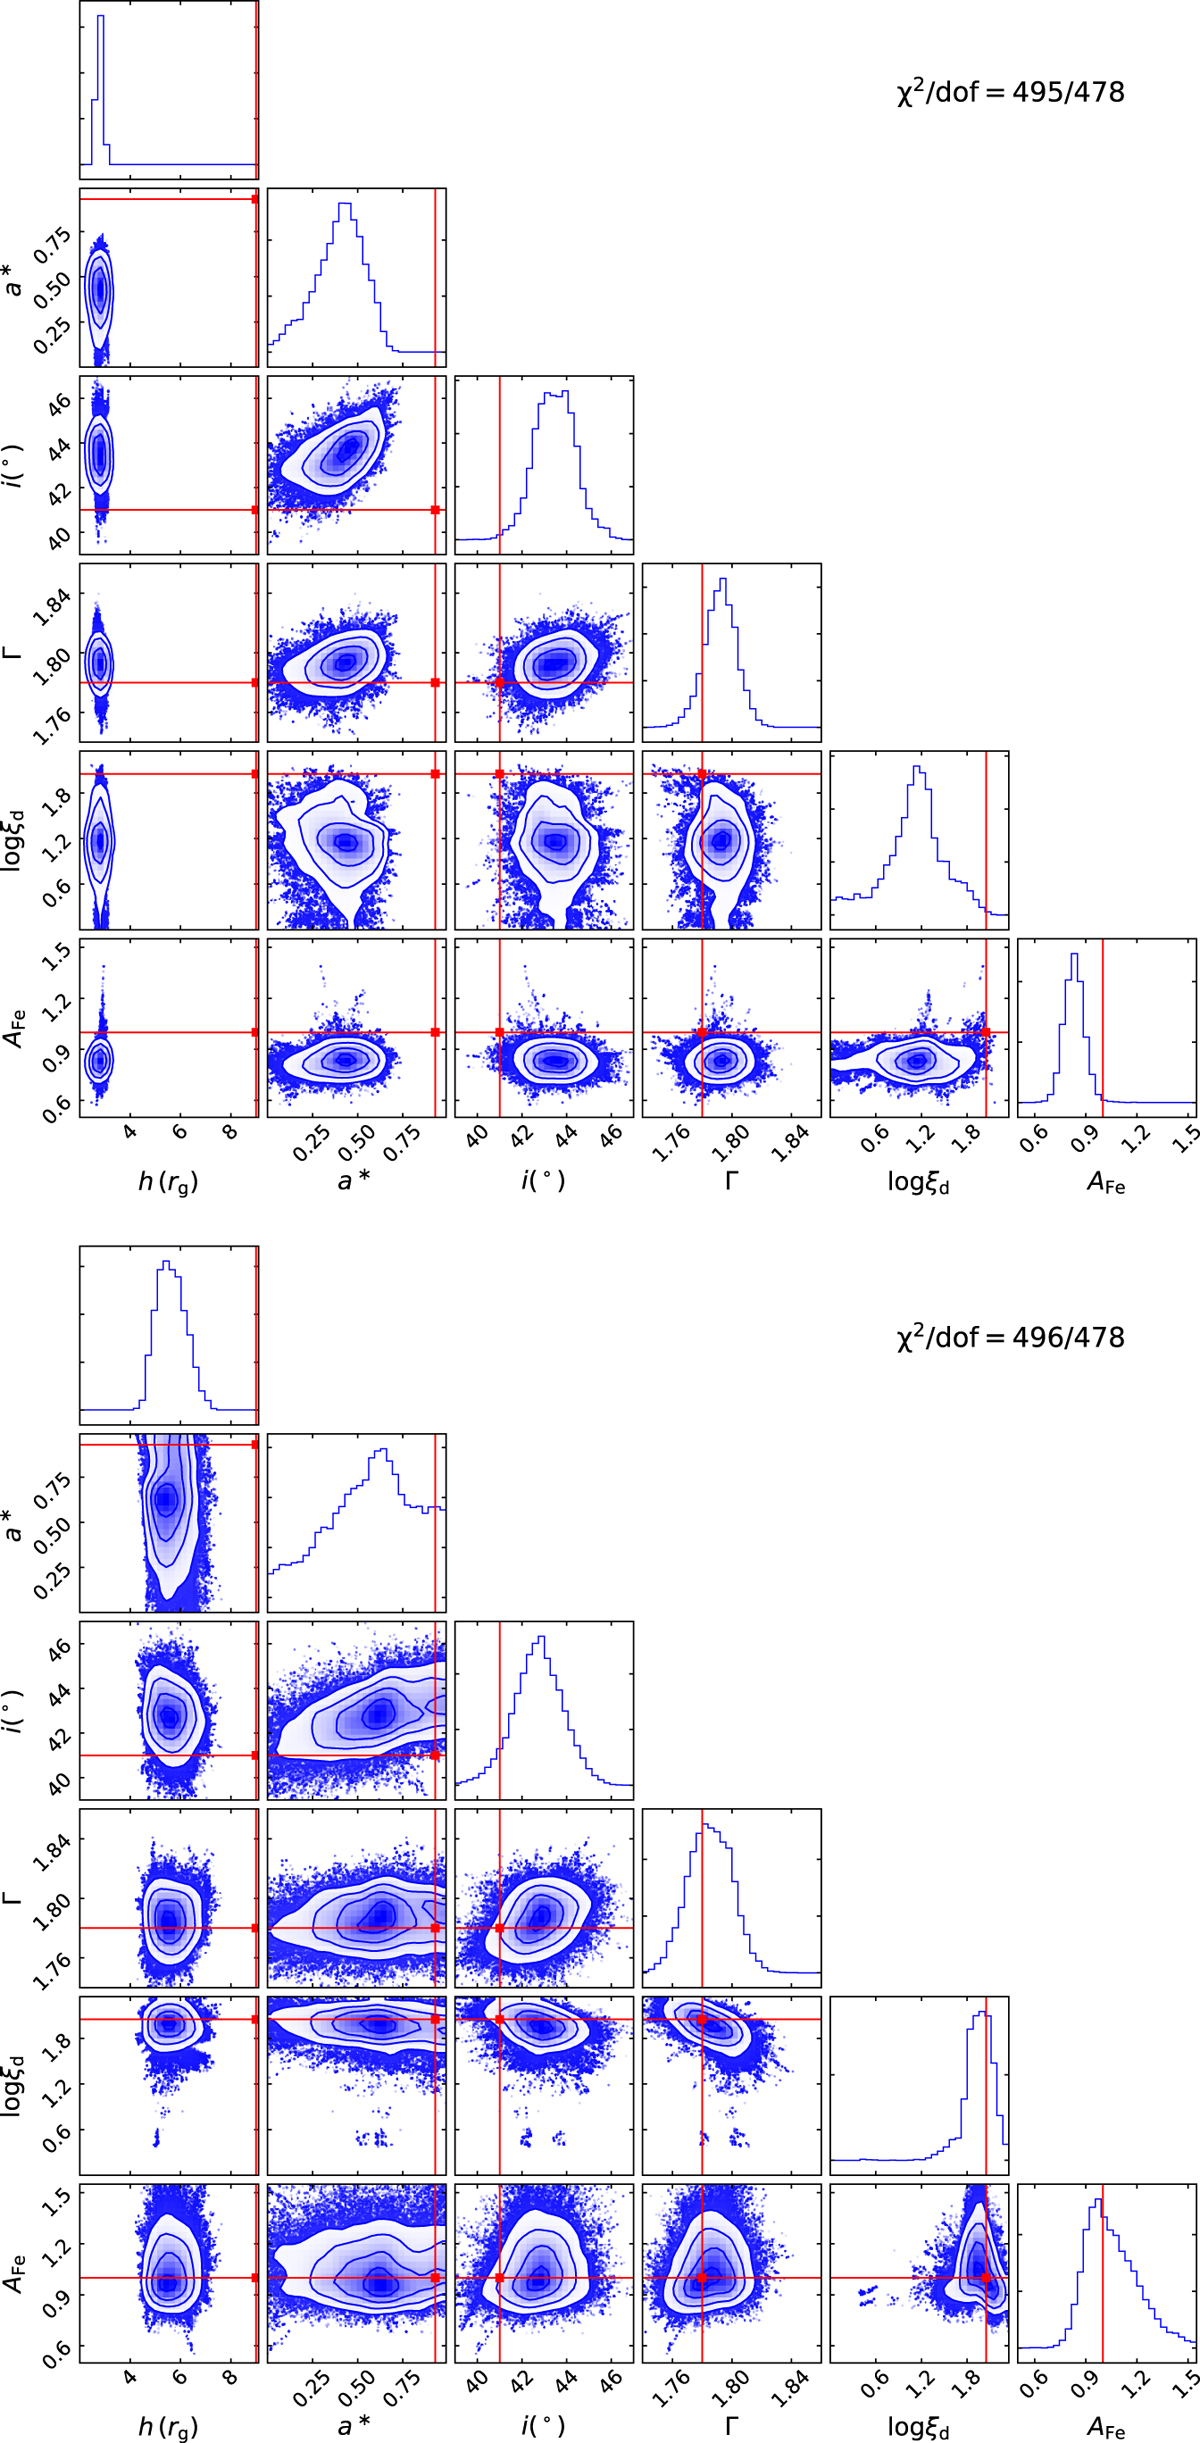
Results of the MCMC analysis for the relevant best-fit reflection parameters corresponding to the two different spectral fits shown in the middle and bottom panels of Fig. 2. The red lines correspond to the input values assumed in order to create the simulations. We show the χ2 values obtained from the corresponding best fit, whose accuracy as a whole is excellent in both cases. The individual parameters, however, are not all correctly retrieved.
Current usage metrics show cumulative count of Article Views (full-text article views including HTML views, PDF and ePub downloads, according to the available data) and Abstracts Views on Vision4Press platform.
Data correspond to usage on the plateform after 2015. The current usage metrics is available 48-96 hours after online publication and is updated daily on week days.
Initial download of the metrics may take a while.