Fig. 8
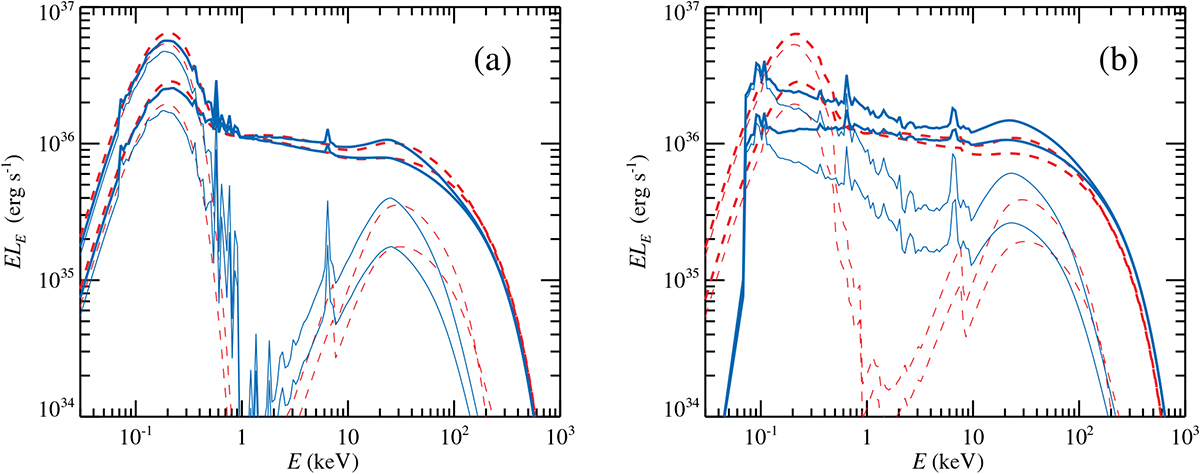
Comparison of the self-consistent spectra from the sandwich corona for two reflection models, xillverCp (solid blue curves) and pexriv (dashed red curves), for two different ionization parameters (a) log ξ = 1 and (b) log ξ = 3. The reflected and reprocessed blackbody spectra are shown by thin lines and the total spectrum by the thick lines. The upper and lower curves correspond to two inclinations, i = 18° and 60°, respectively.
Current usage metrics show cumulative count of Article Views (full-text article views including HTML views, PDF and ePub downloads, according to the available data) and Abstracts Views on Vision4Press platform.
Data correspond to usage on the plateform after 2015. The current usage metrics is available 48-96 hours after online publication and is updated daily on week days.
Initial download of the metrics may take a while.