Fig. 7
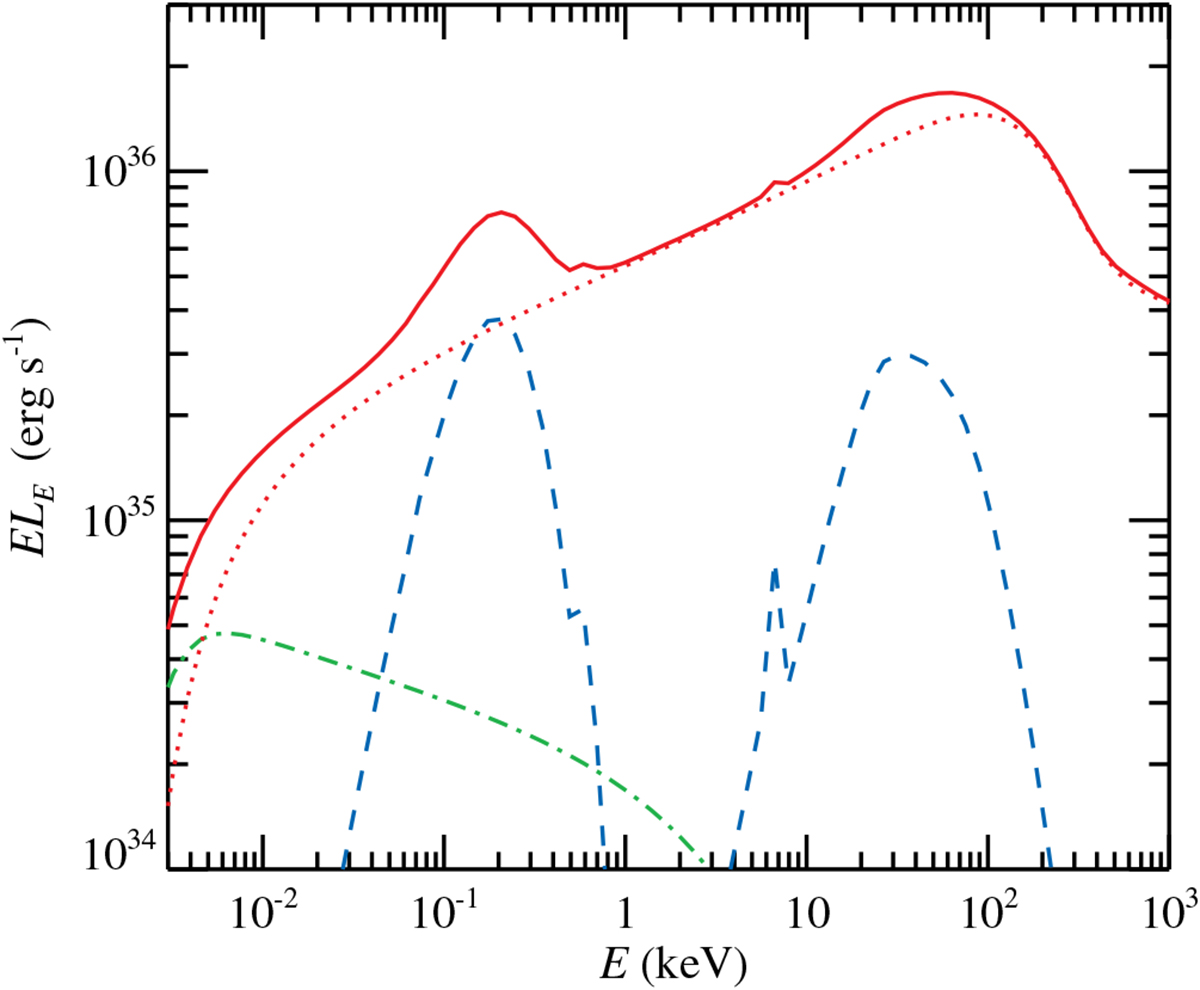
Example of a synchrotron self-Compton spectrum from hot plasma with a hybrid electron distribution. The components due to reflection/reprocessing with the reflection fraction of 0.3 and the ionization parameter of log ξ = 1 and the blackbody of the temperature of 50 eV due to the reprocesses emission are shown together by the blue dashed curve. The escaping synchrotron spectrum is shown by the green dot-dashed line, synchrotron Comptonization spectrum is shown by the red dotted curve, and the total spectrum is given by the red solid curve.
Current usage metrics show cumulative count of Article Views (full-text article views including HTML views, PDF and ePub downloads, according to the available data) and Abstracts Views on Vision4Press platform.
Data correspond to usage on the plateform after 2015. The current usage metrics is available 48-96 hours after online publication and is updated daily on week days.
Initial download of the metrics may take a while.