Fig. 3
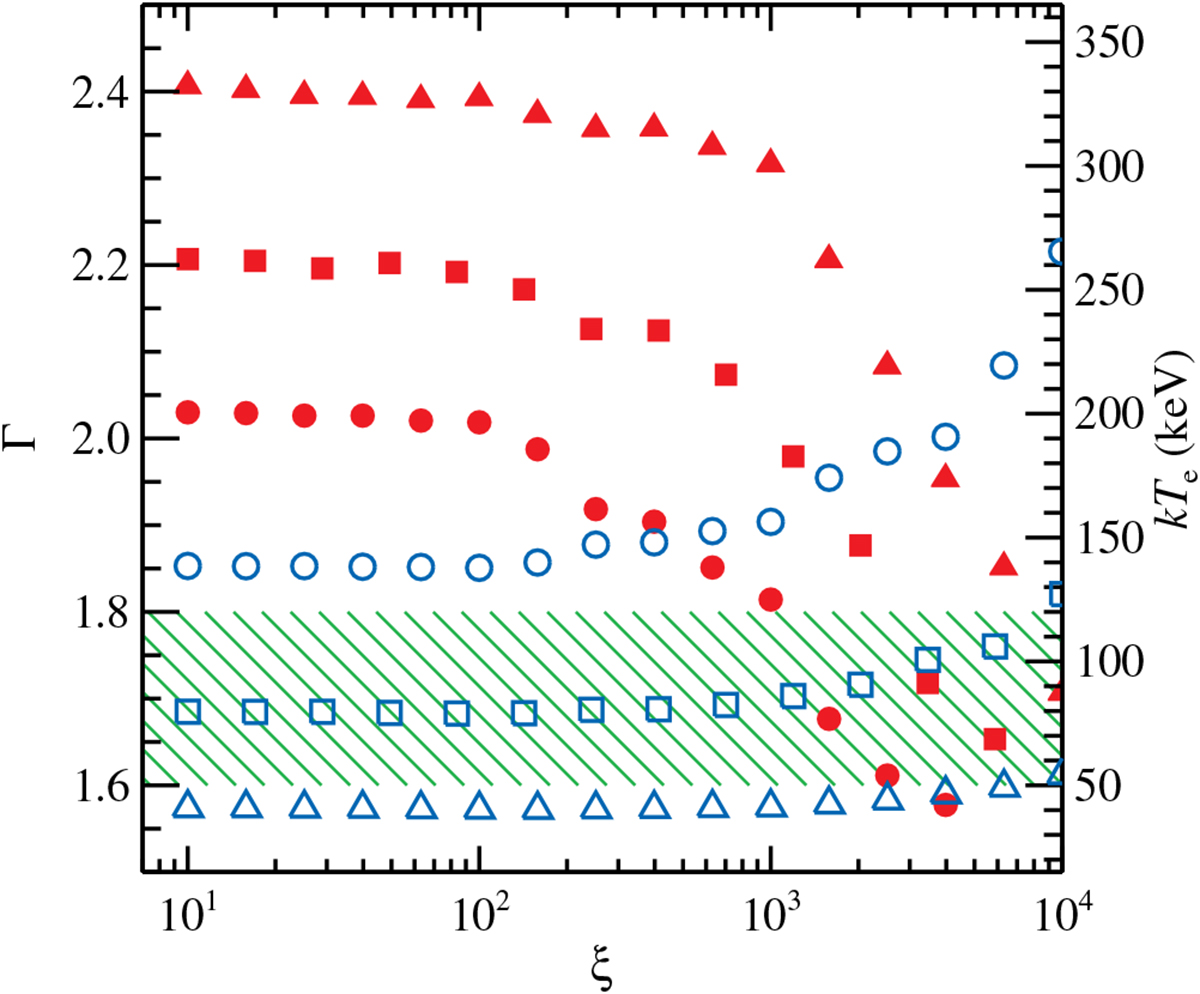
Dependence of the 2–10 keV photon spectral index Γ of the Comptonized spectra from the sandwich corona (red filled symbols and left axis) and of the coronal temperature kTe (blue open symbols and right axis) on the ionization parameter for various coronal optical depths. Circles, squares, and triangles correspond to τT = 0.2, 0.4, and 0.8, respectively. The shaded area represents the typical observed range for Γ (1.6–1.8) and kTe (50–120 keV) (Wardziński et al. 2002; Zdziarski & Gierliński 2004; Ibragimov et al. 2005; Torii et al. 2011; Burke et al. 2017).
Current usage metrics show cumulative count of Article Views (full-text article views including HTML views, PDF and ePub downloads, according to the available data) and Abstracts Views on Vision4Press platform.
Data correspond to usage on the plateform after 2015. The current usage metrics is available 48-96 hours after online publication and is updated daily on week days.
Initial download of the metrics may take a while.