Fig. 2
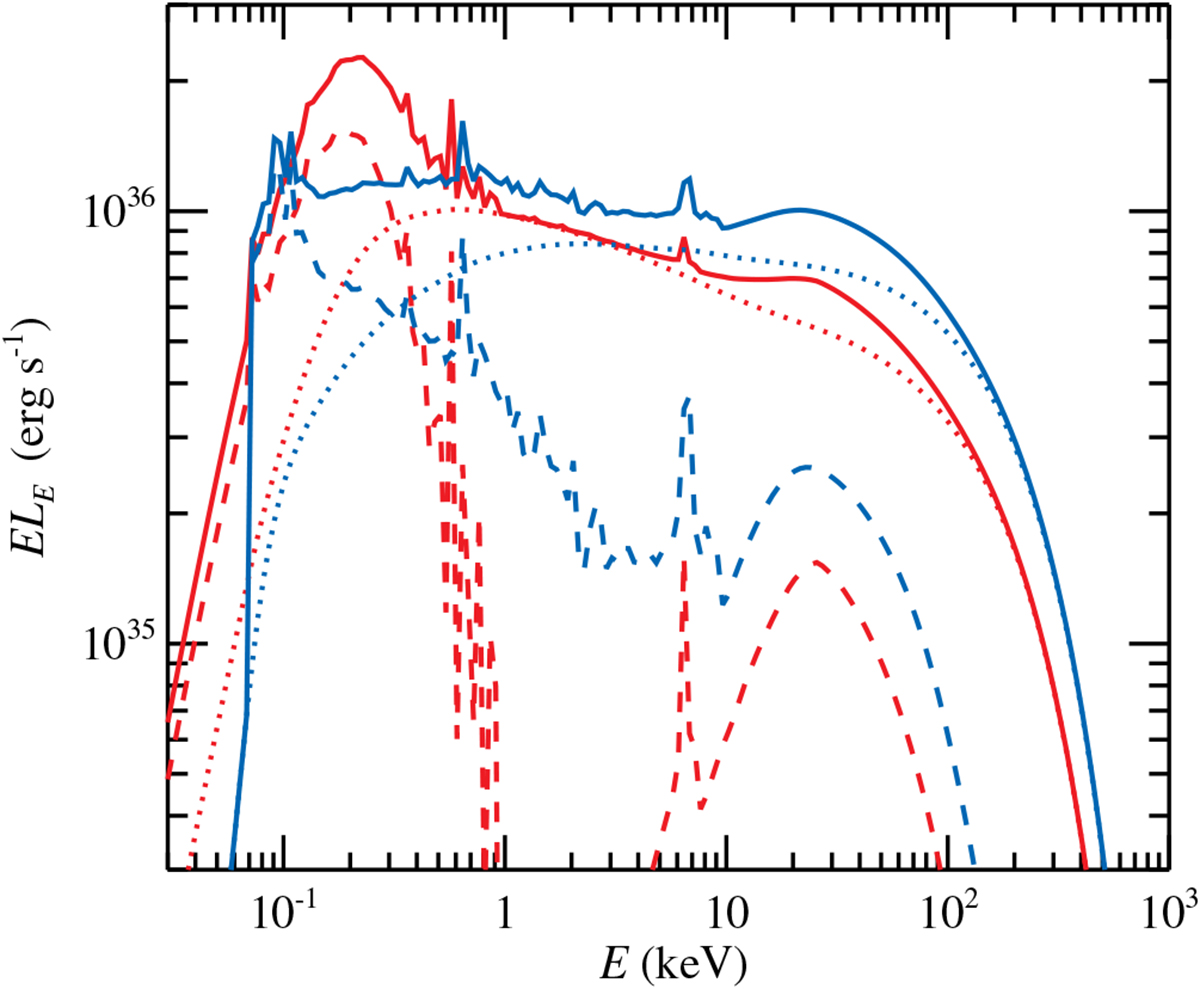
Self-consistent spectra from a homogeneous slab corona of τT = 0.4 above a disc as observed at inclination i = 60°. The red and blue curves correspond to log ξ = 1 and 3, respectively. The dotted lines show the Comptonization continuum, the dashed lines show the reflection xillverCp spectrum together with reprocessed blackbody emission, and the solid lines give the total spectrum. The reflection spectra have been re-binned at a resolution Δ log E = 0.025. The bolometric luminosity of the reflection spectrum here is smaller than that of the Comptonization continuum because part of the reflected/reprocessed emission is Compton scattered in the corona.
Current usage metrics show cumulative count of Article Views (full-text article views including HTML views, PDF and ePub downloads, according to the available data) and Abstracts Views on Vision4Press platform.
Data correspond to usage on the plateform after 2015. The current usage metrics is available 48-96 hours after online publication and is updated daily on week days.
Initial download of the metrics may take a while.