Fig. 2
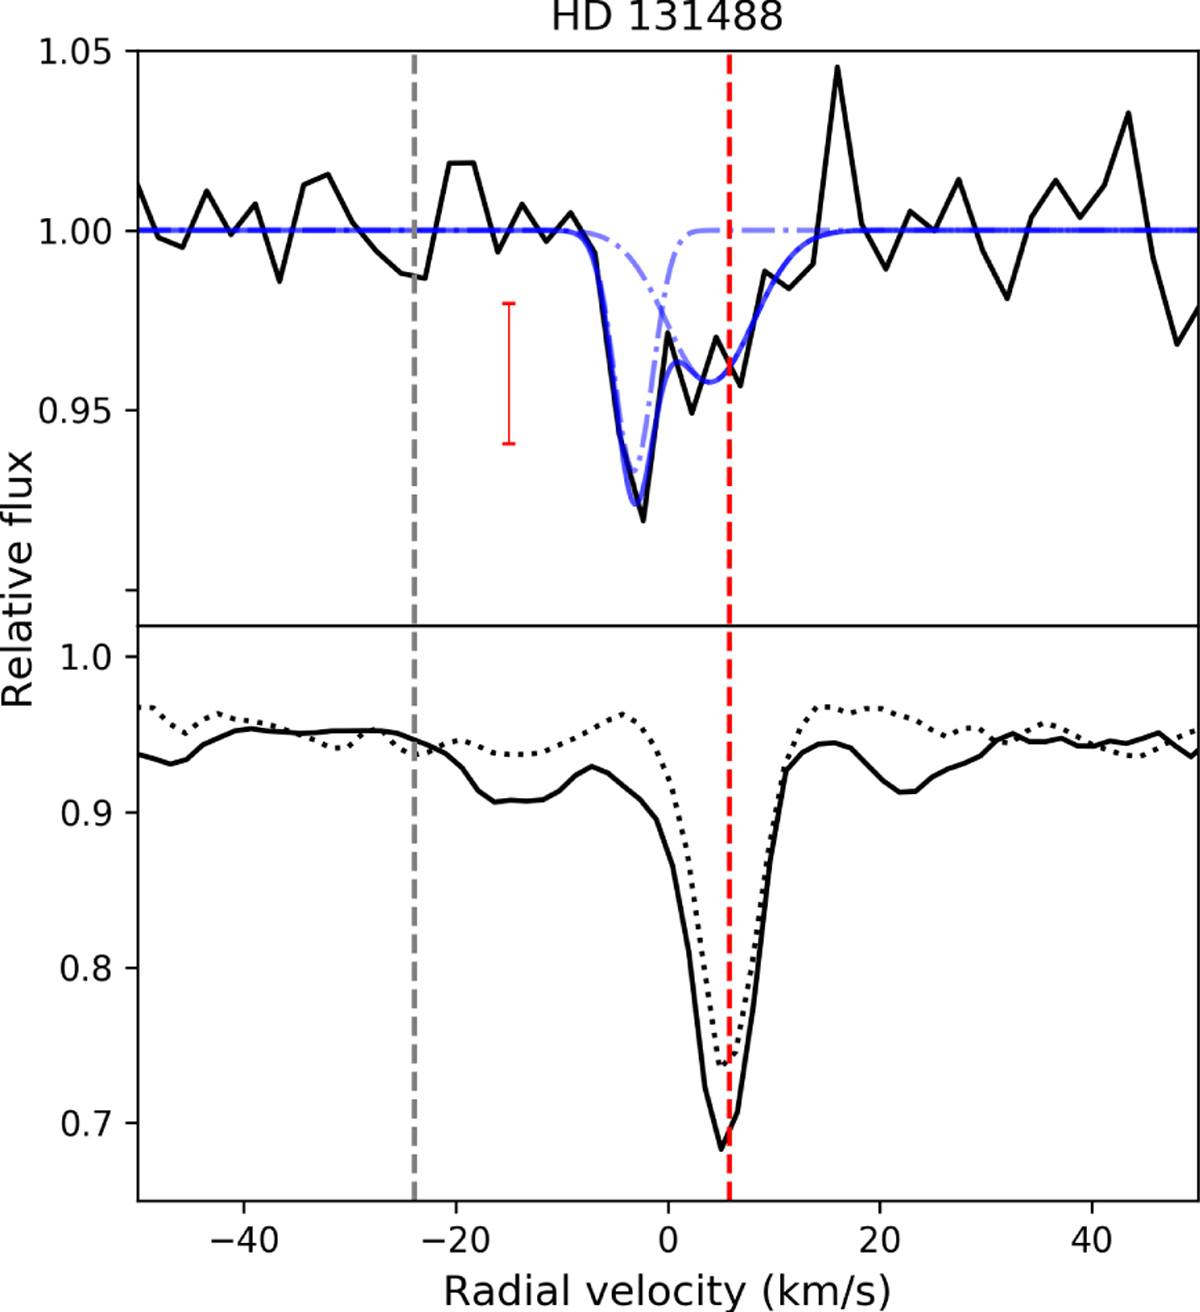
Top panel: non-photospheric Ca II K feature profile of HD 131488. The observed spectrum is plotted with a black solid line. The Ca II K feature is fit with two Gaussians, plotted with a blue dash-dotted line; the blue continuous line is the sum of both Gaussians. A 3σ error bar is plotted in red. Bottom panel: both Na I D2 (continuous line) and Na I D1 (dotted line) components.
Current usage metrics show cumulative count of Article Views (full-text article views including HTML views, PDF and ePub downloads, according to the available data) and Abstracts Views on Vision4Press platform.
Data correspond to usage on the plateform after 2015. The current usage metrics is available 48-96 hours after online publication and is updated daily on week days.
Initial download of the metrics may take a while.