| Issue |
A&A
Volume 614, June 2018
|
|
|---|---|---|
| Article Number | A112 | |
| Number of page(s) | 8 | |
| Section | Interstellar and circumstellar matter | |
| DOI | https://doi.org/10.1051/0004-6361/201732325 | |
| Published online | 22 June 2018 | |
Interstellar bromine abundance is consistent with cometary ices from Rosetta
1
Leiden Observatory, Leiden University,
PO Box 9513,
2300
RA Leiden, The Netherlands
e-mail: This email address is being protected from spambots. You need JavaScript enabled to view it.
2
Raymond and Beverly Sackler Laboratory for Astrophysics, Leiden Observatory, Leiden University,
PO Box 9513,
2300
RA Leiden, The Netherlands
3
Institute of Astronomy, University of Cambridge,
Madingley Road,
Cambridge
CB3 0HA, UK
e-mail: This email address is being protected from spambots. You need JavaScript enabled to view it.
Received:
20
November
2017
Accepted:
23
February
2018
Abstract
Context. Cometary ices are formed during star and planet formation, and their molecular and elemental makeup can be related to the early solar system via the study of inter- and protostellar material. Aims. We set out to place the first observational constraints on the interstellar gas-phase abundance of bromine (Br). We further aim to compare the protostellar Br abundance with that measured by Rosetta in the ices of comet 67P/Churyumov–Gerasimenko.
Methods. Archival Herschel data of Orion KL, Sgr B2(N), and NGC 6334I are examined for the presence of HBr and HBr+ emission or absorption lines. A chemical network for modelling HBr in protostellar molecular gas is compiled to aid in the interpretation.
Results. HBr and HBr+ were not detected towards any of our targets. However, in the Orion KL Hot Core, our upper limit on HBr/H2O is a factor of ten below the ratio measured in comet 67P. This result is consistent with the chemical network prediction that HBr is not a dominant gas-phase Br carrier. Cometary HBr is likely predominantly formed in icy grain mantles which lock up nearly all elemental Br.
Key words: astrochemistry / techniques: spectroscopic / molecular processes / stars: protostars / ISM: molecules
© ESO 2018
1 Introduction
Observations of halogen-bearing species in molecular gas can probe the gas-to-ice depletion of volatile elements during star and planet formation (Gerin et al. 2016). Previous studies have characterized the abundance of fluorine (F) and chlorine (Cℓ) in protostellar gas. We analyse archival data from the Herschel Space Observatory to constrain the gas-phase abundance budget of bromine (Br) and thus expand the overall knowledge of interstellar halogen chemistry. With the recent detection of the organohalogen CH3Cℓ (Fayolle et al. 2017), constraints on the abundances of Br could also give information on the presence of organobromine compounds in the interstellar medium.
The solar abundances of F and Cℓ are (3.63 ± 0.11) × 10−8 and (3.16 ± 0.95) × 10−7, respectively (Asplund et al. 2009). The gas-phase HCℓ abundance in dense protostellar cores is [HCℓ/H2] ~ 10−10, with Cℓ depleted by a factor 100–1000 (Blake et al. 1985; Schilke et al. 1995; Zmuidzinas et al. 1995; Salez et al. 1996; Neufeld & Green 1994; Peng et al. 2010; Kama et al. 2015). Models indicate that the missing Cℓ is in HCℓ ice (Kama et al. 2015). A high Cℓ fraction in HCℓ ice was confirmed in situ for comet 67P/Churyumov–Gerasimenko (hereafter 67P/C–G) with Rosetta, which recently measured HCℓ/H2O ≈ 1.2 × 10⁻⁴ (Dhooghe et al. 2017), close to Herschel upper limits at comets Hartley 2 and Garradd (Bockelée-Morvan et al. 2014).
In contrast to F and Cℓ, the solar and interstellar Br abundance is unknown, but in meteorites it is equivalent to Br/H = (3.47 ± 0.02) × 10−10 (Lodders et al. 2009). The two stable isotopes of bromine are 79Br and 81Br, with a terrestrial abundance ratio of 79Br/81Br = 1.03 (Böhlke et al. 2005). For comet 67P/C–G, the Rosetta spacecraft detected HBr and measured an elemental ratio of Br/O = (1 − 7) × 10−6 in the inner coma, consistent with nearly all bromine being locked in ice, analogously to chlorine.
Accounting for the range of variation seen in 67P/C–G and the uncertainties in terrestrial data, the cometary Br/Cℓ value of ≈ 0.02 (Dhooghe et al. 2017) is consistent with the bulk Earth estimate of Br/Cℓ ≈ 0.04 (Allègre et al. 2001).
If Br hasa similar depletion level as Cℓ in protostellar gas, it may be detectable as HBr at a sensitivity of δT ≲0.01 × T(HCℓ), where T is the intensity in kelvin. The lowest rotational transitions of HBr are at around 500, 1000, and 1500 GHz. These frequencies are not observable from the ground, but were covered by the Herschel/HIFI spectrometer. We also consider the potentially abundant molecular ion HBr+. During regular science observations, HIFI serendipitously covered transitions of HBr and HBr+ towards the bright protostellar regions Orion KL, Sagittarius B2 North (hereafter Sgr B2(N)), and NGC6334I. We use these data to constrain the gas-phase abundance of Br-carriers.
In Sect. 2, we summarise the spectroscopy and the archival Herschel data, which are analysed and discussed in Sect. 3. Section 4 compares the interstellar observations with cometary detections in 67P/C–G. In Sect. 5, we review the interstellar chemistry of Br. Our conclusions are presented in Sect. 6.
2 Data
2.1 Spectroscopy of HBr and HBr+
Measurements on rotational lines of HBr were performed by Van Dijk & Dymanus (1969) for the hyperfine components of the first rotational transition and later extended by Di Lonardo et al. (1991) up to Ju = 9. The first three rotational transitions of both H79Br and H81Br are found at frequencies just above 500, 1000, and 1500 GHz, respectively (Table A.1). The three lowest rotational transitions of HBr+ are found at 1188.2, 1662.7, and 2136.8 GHz and also display hyperfine splitting (Saykally & Evenson 1979; Lubic et al. 1989). However, insufficient spectroscopic data of HBr+ are available to determine column densities. The lowest HBr and HBr+ transition frequencies fall in spectral regions with heavy atmospheric absorption and are best observed from space.
2.2 Archival Herschel observations and selected sources
The Herschel Space Observatory mission (Pilbratt et al. 2010), active from 2009 to 2013, was the most sensitive observatory to date in the terahertz frequency range. We investigate archival high spectral resolution and broad wavelength coverage data from its heterodyne instrument, HIFI (de Graauw et al. 2010).
The HEXOS guaranteed-time key program (PI E.A. Bergin, Bergin et al. 2010) obtained full spectral scans of Orion KL and Sgr B2 (Crockett et al. 2014a,b; Neill et al. 2014), covering three rotational transitions of HBr in HIFI bands 1a, 4a and 6a and HBr+ transitions in band 5a and 6b. The CHESS key program (PI C. Ceccarelli, Ceccarelli et al. 2010) observed NGC6334I in the same HIFI bands (Zernickel et al. 2012). These three sources are bright and well-studied, and have yielded strong detections of the halogens HF and HCℓ with the latter having integrated intensities of ∫ Tmbdv = 701.9 K km s−1 over two lines for Orion KL and ∫ Tmbdv = 40 K km s−1 over three lines for NGC6334I. Line intensities one to two orders of magnitude lower than the HCℓ peak brightness should be detectable, based on 3σ noise levels of ~0.36 K km s−1 and ~0.08 K km s−1 for these sources, respectively. The observational details of these three sources are listed in Table 1.
Source parameters in HIFI band 1a.
2.3 Analysis method
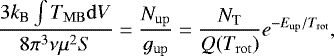
All sources are inspected for features corresponding to transitions of H79∕81Br and HBr+ using the Weeds addition (Maret et al. 2011) of the Continuum and Line Analysis Single-dish Software (CLASS1). For line identification, we use the JPL2 (Pickett et al. 1998)and CDMS3 (Müller et al. 2001, 2005) spectroscopy databases. Source velocities matching previous detections of halogen-bearing molecules are considered most relevant, but we explore a large VLSR range to check for emission or absorption components matching the hyperfine pattern. For emission features, the total column density NT of a species can be calculated by assuming local thermodynamic equilibrium (LTE):
 (1)
(1)
where ∫ TMBdV is the integrated main-beam intensity of a spectral line, ν the transition frequency, μ2 the dipole moment, S the transition strength, gup the upper state degeneracy, Q(Trot) the rotational partition function, Eup the upper state energy and Trot the rotational temperature. Upper limits are given at 3σ confidence and calculated by  RMS, where δν is the velocity resolution, ΔV the line width (estimated based on other transitions in the spectrum) and RMS the root mean square noise in Kelvin. A factor of 1.1 accounts for the flux calibration uncertainty of 10% (Roelfsema et al. 2012).
In the source sample, the hydrogen halides HF and HCℓ are also found in absorption. We calculate the column density corresponding to absorption features from:
 (2)
(2)
and
 (3)
(3)
where τ is the optical depth, TMB the brightness temperature of the feature and Tcont the continuum level. λ is the wavelength of the transitions and gl and gu are its lower and upper state degeneracies. For non-detections, a 3σ upper limit column density is determined using TMB = Tcont–3 × RMS and assuming ΔV equals the average line width for other species in the source.
If the source does not fill the entire HIFI beam (at 500 GHz,  ), we correct the column densities for beam dilution by applying the factor
  , where θS is the source size and θB the beam size. Source sizes are taken from literature, see Table 1, and are used as the physical size of the emitting regions. Deviations from the actual emitting area of a species may occur and would result in different column densities. The source-averaged column density is calculated from NS = NT∕ηBF.
We determined the upper limit column densities from the HBr J = 1x → 02 transitions at 500 GHz in HIFI band 1a, because of the low noise levels in this frequency range. HBr is considered as the sum of its isotopologs, H79 Br and H81 Br. We assume that the cosmic and local isotope ratios are equal (in the solar system [79 Br]/[81Br] = 1.03). Aside from the molecular mass, several spectroscopic parameters for transitions of both isotopes, such as Aij and Eup, are identical. The 13 → 02 line is the strongest hyperfine component and constrains the column density the most and is therefore used to give the most stringent upper limits.
3 Search for HBr and HBr+ in the Herschelspectra
Analysis of the HIFI spectra of Orion KL, Sgr B2(N), and NGC6334I yielded no detections of HBr or HBr+ features in emission or absorption. Figure 1 shows the positions of the HBr transitions at 500 GHz in the Orion KL spectrum at VLSR = 9 km s−1, corresponding to the average velocity of the Plateau components. The data were analysed over a large range of source velocities, mainly focussing on velocities of known components. For Sgr B2(N) and NGC6334I the same figures can be found in Appendix B.
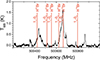 |
Fig. 1 Positions of the J = 1x → 02 transitions of H79Br and H81Br at 500 GHz towards Orion KL for VLSR = 9 km s−1. |
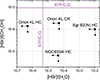 |
Fig. 2 (H)Br/CH3OH and (H)Br/(H2)O ratios plotted for 67P/C–G (purple lines, Dhooghe et al. 2017) and the upper limits on these ratios for the protostar sample (thiswork). |
4 Protostellar versus cometary abundance
The upper limit abundance ratios of HBr toward the protostellar sources can be compared with measurements taken by the Rosetta mission of the coma gas of comet 67P/C–G (Dhooghe et al. 2017). We look at column density ratios of HBr (Table C.1) with respect to those of H2, H2 O, CH3OH, HF, and HCℓ (Table C.2). The N(H79+81Br)/N(X) column density ratios based either on emission or absorption upper limits for Orion KL, Sgr B2(N), and NGC6334I are listed in Table 2.
The upper limits in emission are based on an excitation temperature of 100 K, which is chosen to be within a factor of a few of all the detected molecules we compare with. For an assessment of the impact of Tex, Fig. C.1 shows the temperature dependence of the 3 σ upper limit for the first three hyperfine transitions of H79∕81Br, including beam dilution correction for the Orion KL Hot Core. For Sgr B2(N) and NGC6334I, a distinction is made between the hot core and envelope components. If a source contains multiple kinematic components of a species, we adopt the dominant one.
For 67P/C–G, Dhooghe et al. (2017) give the Br/O ratio and the CH3OH abundance. The cometary halogens are equal to the halides (HX), but the O abundance is the sum of H2 O, CO, CO2 and O2. For the comet, we can therefore take Br ≡ HBr, and we further assume O ≈ H2O. A ratio of CH3OH/H2O = 3.1 – 5.5 × 10⁻³ has been measured by Le Roy et al. (2015).
A comparison of HBr with H2O and CH3OH is shown in Fig. 2, and the full set of abundance ratios of HBr with other molecules is given in Table 2. The HBr/CH3OH ratio in all our targets is constrained to be below that in comet 67P/C–G. This is not necessarily due to a particularly high methanol abundance in our targets, but rather could signify a low fraction of Br atoms locked up in gas-phase HBr molecules. The only source where we can constrain the HBr/H2O ratio to be below that in 67P/C–G is the Orion KL Hot Core. This may, again, be explained with a low fraction of Br atoms in gas-phase HBr. If all elemental bromine were in gaseous HBr, we would have expected to have made a detection in the Orion KL Hot Core. A comparison with the cometary measurements suggests, then, that the HBr molecules are formed in icy grain mantles, rather than in the gas phase, or sublimate from the grain surface at a temperature higher than water.
The HBr/HCℓ abundance ratio in the Orion KL Plateau is constrained to be a factor ≳4 below that in 67P/C–G. The difficulties in forming a large abundance of HBr in the gas phase when HCℓ is clearly present lead us to conclude that cometary HBr has an origin in grain surface chemistry in volatile-rich ice mantles.
Abundance ratios of H79+81Br (≡B) upper limit column density with H2, CH3 OH, H2 O, HF, and H35+37Cℓ (≡HCℓ) for Orion KL, Sgr B2(N), and NGC6334I, compared with abundance ratios derived for 67P/C-G.
5 Interstellar chemistry of Br
5.1 Reactions of Br
The inter- and protostellar chemistry of bromine is poorly characterized, compared to that of fluorine and chlorine (e.g. Jura 1974; Blake et al. 1986; Schilke et al. 1995; Neufeld & Wolfire 2009). In Table 3, we present a network compiled from published measurements and calculations, with missing data filled in with values from the Cℓ and F networks. Some reactions are not listed in this table, for these reactions we adopt the equivalent Cℓ reaction parameters of Neufeld & Wolfire (2009, their Table 1).
The neutral-neutral chemistry, reactions (1) to (3), is relatively well studied. The Br+H2 reaction leading to HBr+H, with an 8812 K activation energy, has been investigated by, for example, Eyring (1931); Plooster & Garvin (1956) and Fettis et al. (1960). The HBr+H abstraction and exchange reactions have been studied by Plooster & Garvin (1956), and by White & Thompson (1974) whose channel-by-channel rates are consistent with the total rate from Endo & Glass (1976). Based on Table 3, excluding other reactions, the competition between the Br+H2 formation route and destruction via the HBr+H abstraction reaction strongly favours atomic Br. Thus gas-phase neutral-neutral chemistry is not expected to contribute to HBr formation unless temperatures of ~1000 K – possible in hot cores, outflow shocks, and inner regions of protoplanetary disks – are involved.
Due to its low first ionization potential (11.8 eV), Br is easily ionized and HBr can form in ion-neutral chemistry via the set of reactions (4)–(8) in Table 3. By analogy with F and Cℓ, reactions (4)–(8) should be fast, of order 10−10–10−7 cm3s−1 (Neufeld & Wolfire 2009). However, as pointed out by Mayhew & Smith (1990), the Br+ +H2 reaction is endothermic. We adopt a H2 and HBr+ dissociation energy (ED) difference of ≈6200 K, estimated from the proton affinity (PA) and ionization potential (IP) of Br via Ea = PA(Br) + IP(Br) – IP(H2) – ED(H2), suggested by D. Neufeld (priv. comm.). The branching ratio of the dissociative recombination reactions (7) and (8) is unknown, but the dissociation energy of HBr (D0 ≈ 3.78 eV) is lower than that of H2 (4.48 eV), while those of HCℓ and HF are similar and higher (4.43 and 5.87 eV, Darwent 1970). The branching ratio into the HBr+H channel may thus be lower than the 10 % of the equivalent Cℓ reaction, which would lower the fraction of Br stored in HBr. For the photoionization and -dissociation rates, we adopt order-of-magnitude numbers from the corresponding Cℓ and F reactions in Neufeld & Wolfire (2009).
The formation of HBr via H+Br collision requires a three-body interaction and thus is most efficient on grain surfaces (e.g. Ree et al. 2004).
Chemical reaction network for bromine.
5.2 Chemical modelling results
We appended the reactions from Table 3 to the OSU2009 network and ran time-dependent, gas-phase only simulations to 1.5 Myr with the Astrochem gas-phase chemistry code (Maret & Bergin 2015). We ignored freeze-out in order to test the relevance of the Herschel upper limits with the highest possible gas-phase elemental abundances. The physical conditions were set to AV = 20 mag (assuming a standard interstellar radiation field), nH = 106 cm−3, and Tkin = 150 K. The initial halogen abundances were either entirely atomic ions (Cℓ+ and Br+) or entirely diatomic hydrides (HCℓ and HBr), but this had only a minor impact on the end-state abundances. We show the modelling results in Fig. 3 for three cases: 1) all elemental Br and Cℓ in the gas-phase; 2) undepleted Br and Cℓ depleted from the gas-phase by two orders of magnitude 3) both Br and Cℓ depleted by two orders of magnitude. Varying nH by an orderof magnitude had little impact on the abundances, while varying Tkin by 50 K induced a scatter of 0.5 dex in the plotted logarithmic abundance ratios. None of the models were strongly constrained by the upper limits, as we discuss below.
For the adopted physical conditions, the chemical network predictions place the gas-phase HBr abundance two orders of magnitude below the observed upper limit for the Orion KL Hot Core. All literature studies of the gas-phase Cℓ abundance in protostellar sources find gas-phase Cℓ depletions of at least a factor 100 to 1000 (Dalgarno et al. 1974; Blake et al. 1986; Schilke et al. 1995; Peng et al. 2010; Kama et al. 2015). However, the ice fraction in the Orion KL Hot Core is likely very small, so we expect model 1 to provide a reasonable prediction of the gas-phase (H)Cℓ and (H)Br abundance in this source.
In the NGC 6334I Hot Core, HBr may be just below the upper limit from Herschel if elemental Br is not depleted from the gas, while Cℓ is known to be depleted by a factor 1000. This seems unlikely.
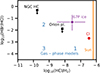 |
Fig. 3 Ratio of HBr to HCℓ abundance in the NGC 6334I Hot Core and the Orion KL Plateau (upper limits for both sources) and pure gas-phase chemical models (1, 2, 3; see text), and in comet 67P/C–G (Dhooghe et al. 2017). We also show the elemental Cℓ/H2 and Br/Cℓ ratios for meteorites (red circle) and the sun (orange line; the solar Br abundance is unknown). Models are shown for nH = 106 cm−3 and Tkin = 150 K. Variations of ± 1 in log (nH) and ± 50 K in Tkin induce negligible and 0.5 dex variations, respectively. Model 1 has all elemental Cℓ and Br in the gas; in 2 only Cℓ, and in 3 both Cℓ and Br are depleted from the gas by a factor of 100. |
6 Conclusions
We present the first search for bromine-bearing molecules in the interstellar medium, employing archival Herschel/HIFI data. No detections of HBr or HBr+ are made, and we report upper limits of HBr for Orion KL, Sgr B2 (N), and NGC 6334I. Most of these upper limits lie above the values expected from a simple scaling down of HCℓ emission using the Cℓ/Br elemental ratio.
In the Orion KL Hot Core, the HBr/H2O gas-phase abundance ratio is constrained to be an order of magnitude lower than the measured ratio in comet 67P/C–G. This result, along with the low HBr/CH3OH ratio in all our sources and the low HBr/HCℓ in the Orion KL Plateau, is consistent with our chemical network modelling for Br, which predicts a low fraction of elemental Br in HBr in the gas phase. Our results suggest the HBr detected in high abundance in comet 67P/C–G formed in icy grain mantles.
Acknowledgements
The authors wish to thank Nathan Crockett for providing the data on Orion KL and Sgr B2, and Peter Schilke for the data on NGC6334I. We also thank Frederik Dhooghe for discussing his results on halogens in 67P/C–G and David Neufeld and Catherine Walsh for discussions on the chemistry. MK is supported by an Intra-European Marie Sklodowska-Curie Fellowship. Astrochemistry in Leiden is supported by the Netherlands Research School for Astronomy (NOVA), by a Royal NetherlandsAcademy of Arts and Sciences (KNAW) professor prize, and by the European Union A-ERC grant 291141 CHEMPLAN. HIFI has been designed and built by a consortium of institutes and university departments from across Europe, Canada andthe United States under the leadership of SRON Netherlands Institute for Space Research, Groningen, The Netherlands and with major contributions from Germany, France and the US. Consortium members are: Canada: CSA, U.Waterloo; France: CESR, LAB, LERMA, IRAM; Germany: KOSMA, MPIfR, MPS; Ireland, NUI Maynooth; Italy: ASI, IFSI-INAF, Osservatorio Astrofisico di Arcetri-INAF; Netherlands: SRON, TUD; Poland: CAMK, CBK; Spain: Observatorio Astronómico Nacional (IGN), Centro de Astrobiología (CSIC-INTA). Sweden: Chalmers University of Technology - MC2, RSS & GARD; Onsala Space Observatory; Swedish National Space Board, Stockholm University - Stockholm Observatory; Switzerland: ETH Zurich, FHNW; USA: Caltech, JPL, NHSC.
Appendix A Linelist of HBr transitions in range of HIFI
The HIFI instrument on the Herschel Space Observatory covered the three lowest rotational transition groups of HBr, which are summarised in Table A.1. J = 1x → 02 fell in band 1a, J = 2x → 1y in band 4a and J = 3x → 2y in band 6a.
H79∕81Br transitions between 500 and 1501 GHz.
Appendix B Sgr B2(N) and NGC6334I at 500 GHz
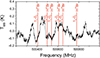 |
Fig. B.1 Positions of H79∕81Br transitions for J = 1x → 02 around 500 GHz in HIFI band 1a towards Sgr B2(N) for VLSR = 64 km s−1. |
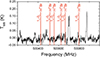 |
Fig. B.2 Positions of H79∕81Br transitions for J = 1x → 02 around 500 GHz in HIFI band 1a towards NGC6334I for VLSR = –10 km s−1. |
Appendix C Upper limit column densities of H79+81Br and column densities of reference molecules
Table C.1 lists the upper limit column densities of H79+81Br for the full HIFI band 1a beam (=44 ) in emission and absorption, calculated according to Eqs. (1) and (3). Upper limits have been derived for an excitation temperature of 100 K. The following columns in this table list the beam dilution correction factor and subsequently the beam dilution corrected upper limit column densities.
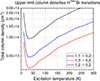 |
Fig. C.1 Upper limit column densities for the H79∕81Br (e.g. 79Br and 81Br are used interchangeably here) J = 1x → 02 transitions plotted versus rotational temperature based on the 3σ values (216 mK km s−1) found for theOrion KL Hot Core and beam-dilution corrected (η = 0.049) |
Table C.2 lists the column densities of the reference molecules H2, H2 O, CH3OH, HF, H35+37Cℓ taken from Crockett et al. (2014a), Neill et al. (2014) and Zernickel et al. (2012).
H79+81Br column densities and beam dilution correction.
Column densities of the reference molecules H2, H2 O, CH3 OH, HF, H35+37Cℓ.
References
- Allègre, C., Manhès, G., & Lewin, É. 2001, Earth Planet. Sci. Lett., 185, 49 [NASA ADS] [CrossRef] [Google Scholar]
- Asplund, M., Grevesse, N., Sauval, A. J., & Scott, P. 2009, ARA&A, 47, 481 [NASA ADS] [CrossRef] [Google Scholar]
- Belikov, A. E., & Smith, M. A. 2008, Russ. J. Phys. Chem. A, 82, 789 [CrossRef] [Google Scholar]
- Bergin, E. A., Phillips, T. G., Comito, C., et al. 2010, A&A, 521, L20 [NASA ADS] [CrossRef] [EDP Sciences] [Google Scholar]
- Blake, G. A., Keene, J., & Phillips, T. G. 1985, ApJ, 295, 501 [NASA ADS] [CrossRef] [Google Scholar]
- Blake, G. A., Anicich, V. G., & Huntress, Jr. W. T. 1986, ApJ, 300, 415 [NASA ADS] [CrossRef] [Google Scholar]
- Bockelée-Morvan, D., Biver, N., Crovisier, J., et al. 2014, A&A, 562, A5 [NASA ADS] [CrossRef] [EDP Sciences] [Google Scholar]
- Böhlke, J. K., de Laeter, J. R., De Bièvre, P., et al. 2005, J. Phys. Chem. Ref. Data, 34, 57 [NASA ADS] [CrossRef] [Google Scholar]
- Ceccarelli, C., Bacmann, A., Boogert, A., et al. 2010, A&A, 521, L22 [NASA ADS] [CrossRef] [EDP Sciences] [Google Scholar]
- Crockett, N. R., Bergin, E. A., Neill, J. L., et al. 2014a, ApJ, 781, 114 [NASA ADS] [CrossRef] [Google Scholar]
- Crockett, N. R., Bergin, E. A., Neill, J. L., et al. 2014b, ApJ, 787, 112 [NASA ADS] [CrossRef] [Google Scholar]
- Dalgarno, A., de Jong, T., Oppenheimer, M., & Black, J. H. 1974, ApJ, 192, L37 [NASA ADS] [CrossRef] [Google Scholar]
- Darwent, B. d. 1970, NIST Spec. Publ., 1 [Google Scholar]
- de Graauw, T., Helmich, F. P., Phillips, T. G., et al. 2010, A&A, 518, L6 [NASA ADS] [CrossRef] [EDP Sciences] [Google Scholar]
- Dhooghe, F., De Keyser, J., Altwegg, K., et al. 2017, MNRAS, 472, 1336 [NASA ADS] [CrossRef] [Google Scholar]
- Di Lonardo, G., Fusina, L., De Natale, P., Inguscio, M., & Prevedelli, M. 1991, J. Mol. Spectrosc., 148, 86 [NASA ADS] [CrossRef] [Google Scholar]
- Endo, H., & Glass, G. 1976, J. Phys. Chem., 80, 1519 [CrossRef] [Google Scholar]
- Eyring, H. 1931, J. Am. Chem. Soc., 53, 2537 [CrossRef] [Google Scholar]
- Fayolle, E. C., Öberg, K. I., Jørgensen, J. K., et al. 2017, Nat. Astron., 1, 703 [NASA ADS] [CrossRef] [Google Scholar]
- Fettis, G., Knox, J., & Trotman-Dickenson, A. 1960, Can. J. Chem., 38, 1643 [CrossRef] [Google Scholar]
- Gerin, M., Neufeld, D. A., & Goicoechea, J. R. 2016, ARA&A, 54, 181 [NASA ADS] [CrossRef] [Google Scholar]
- Jura, M. 1974, ApJ, 190, L33 [NASA ADS] [CrossRef] [Google Scholar]
- Kama, M., Caux, E., López-Sepulcre, A., et al. 2015, A&A, 574, A107 [NASA ADS] [CrossRef] [EDP Sciences] [Google Scholar]
- Le Roy, L., Altwegg, K., Balsiger, H., et al. 2015, A&A, 583, A1 [Google Scholar]
- Lodders, K., Palme, H., & Gail, H.-P. 2009, Landolt Börnstein Group VI Astronomy and Astrophysics Numerical Data and Functional Relationships in Science and Technology Volume 4B [Google Scholar]
- Lubic, K. G., Ray, D., Hovde, D. C., Veseth, L., & Saykally, R. J. 1989, J. Mol. Spectrosc., 134, 21 [NASA ADS] [CrossRef] [Google Scholar]
- Maret, S., & Bergin, E. A. 2015, Astrochem: Abundances of Chemical Species in the Interstellar Medium, Astrophysics Source Code Library [Google Scholar]
- Maret, S., Hily-Blant, P., Pety, J., Bardeau, S., & Reynier, E. 2011, A&A, 526, A47 [NASA ADS] [CrossRef] [EDP Sciences] [Google Scholar]
- Mayhew, C. A., & Smith, D. 1990, Int. J. Mass Spectrom. Ion Process., 100, 737 [NASA ADS] [CrossRef] [Google Scholar]
- Müller, H. S. P., Thorwirth, S., Roth, D. A., & Winnewisser, G. 2001, A&A, 370, L49 [NASA ADS] [CrossRef] [EDP Sciences] [Google Scholar]
- Müller, H. S. P., Schlöder, F., Stutzki, J., & Winnewisser, G. 2005, J. Mol. Struct., 742, 215 [NASA ADS] [CrossRef] [Google Scholar]
- Neill, J. L., Bergin, E. A., Lis, D. C., et al. 2014, ApJ, 789, 8 [NASA ADS] [CrossRef] [Google Scholar]
- Neufeld, D. A., & Green, S. 1994, ApJ, 432, 158 [NASA ADS] [CrossRef] [Google Scholar]
- Neufeld, D. A., & Wolfire, M. G. 2009, ApJ, 706, 1594 [NASA ADS] [CrossRef] [Google Scholar]
- Peng, R., Yoshida, H., Chamberlin, R. A., et al. 2010, ApJ, 723, 218 [NASA ADS] [CrossRef] [Google Scholar]
- Pickett, H. M., Poynter, R. L., Cohen, E. A., et al. 1998, J. Quant. Spec. Radiat. Transf., 60, 883 [Google Scholar]
- Pilbratt, G. L., Riedinger, J. R., Passvogel, T., et al. 2010, A&A, 518, L1 [CrossRef] [EDP Sciences] [Google Scholar]
- Plooster, M. N., & Garvin, D. 1956, J. Am. Chem. Soc., 78, 6003 [CrossRef] [Google Scholar]
- Ree, J., Yoon, S., Park, K., & Kim, Y. 2004, Bull. Korean Chem. Soc., 25, 1217 [CrossRef] [Google Scholar]
- Roelfsema, P. R., Helmich, F. P., Teyssier, D., et al. 2012, A&A, 537, A17 [NASA ADS] [CrossRef] [EDP Sciences] [Google Scholar]
- Salez, M., Frerking, M. A., & Langer, W. D. 1996, ApJ, 467, 708 [NASA ADS] [CrossRef] [Google Scholar]
- Saykally, R. J., & Evenson, K. M. 1979, Phys. Rev. Lett., 43, 515 [NASA ADS] [CrossRef] [Google Scholar]
- Schilke, P., Phillips, T. G., & Wang, N. 1995, ApJ, 441, 334 [NASA ADS] [CrossRef] [Google Scholar]
- Van Dijk, F. A., & Dymanus, A. 1969, Chem. Phys. Lett., 4, 170 [NASA ADS] [CrossRef] [Google Scholar]
- White, J. M., & Thompson, D. L. 1974, J. Chem. Phys., 61, 719 [NASA ADS] [CrossRef] [Google Scholar]
- Zernickel, A., Schilke, P., Schmiedeke, A., et al. 2012, A&A, 546, A87 [NASA ADS] [CrossRef] [EDP Sciences] [Google Scholar]
- Zmuidzinas, J., Blake, G. A., Carlstrom, J., Keene, J., & Miller, D. 1995, ApJ, 447, L125 [NASA ADS] [CrossRef] [PubMed] [Google Scholar]
All Tables
Abundance ratios of H79+81Br (≡B) upper limit column density with H2, CH3 OH, H2 O, HF, and H35+37Cℓ (≡HCℓ) for Orion KL, Sgr B2(N), and NGC6334I, compared with abundance ratios derived for 67P/C-G.
All Figures
|
Fig. 1 Positions of the J = 1x → 02 transitions of H79Br and H81Br at 500 GHz towards Orion KL for VLSR = 9 km s−1. |
| In the text | |
|
Fig. 2 (H)Br/CH3OH and (H)Br/(H2)O ratios plotted for 67P/C–G (purple lines, Dhooghe et al. 2017) and the upper limits on these ratios for the protostar sample (thiswork). |
| In the text | |
|
Fig. 3 Ratio of HBr to HCℓ abundance in the NGC 6334I Hot Core and the Orion KL Plateau (upper limits for both sources) and pure gas-phase chemical models (1, 2, 3; see text), and in comet 67P/C–G (Dhooghe et al. 2017). We also show the elemental Cℓ/H2 and Br/Cℓ ratios for meteorites (red circle) and the sun (orange line; the solar Br abundance is unknown). Models are shown for nH = 106 cm−3 and Tkin = 150 K. Variations of ± 1 in log (nH) and ± 50 K in Tkin induce negligible and 0.5 dex variations, respectively. Model 1 has all elemental Cℓ and Br in the gas; in 2 only Cℓ, and in 3 both Cℓ and Br are depleted from the gas by a factor of 100. |
| In the text | |
|
Fig. B.1 Positions of H79∕81Br transitions for J = 1x → 02 around 500 GHz in HIFI band 1a towards Sgr B2(N) for VLSR = 64 km s−1. |
| In the text | |
|
Fig. B.2 Positions of H79∕81Br transitions for J = 1x → 02 around 500 GHz in HIFI band 1a towards NGC6334I for VLSR = –10 km s−1. |
| In the text | |
|
Fig. C.1 Upper limit column densities for the H79∕81Br (e.g. 79Br and 81Br are used interchangeably here) J = 1x → 02 transitions plotted versus rotational temperature based on the 3σ values (216 mK km s−1) found for theOrion KL Hot Core and beam-dilution corrected (η = 0.049) |
| In the text | |
Current usage metrics show cumulative count of Article Views (full-text article views including HTML views, PDF and ePub downloads, according to the available data) and Abstracts Views on Vision4Press platform.
Data correspond to usage on the plateform after 2015. The current usage metrics is available 48-96 hours after online publication and is updated daily on week days.
Initial download of the metrics may take a while.