| Issue |
A&A
Volume 614, June 2018
|
|
|---|---|---|
| Article Number | A6 | |
| Number of page(s) | 11 | |
| Section | Astrophysical processes | |
| DOI | https://doi.org/10.1051/0004-6361/201732304 | |
| Published online | 06 June 2018 | |
Fermi-LAT observation of nonblazar AGNs
1
ICRANet,
Piazza della Repubblica 10,
65122
Pescara,
Italy
e-mail: This email address is being protected from spambots. You need JavaScript enabled to view it.
2
ICRANet Armenia,
Marshall Baghramian Avenue 24a,
Yerevan
0019,
Republic of Armenia
3
Yerevan State University,
Alek Manukyan Str. 1,
Yerevan
0025,
Republic of Armenia
Received:
16
November
2017
Accepted:
27
January
2018
Abstract
Context. Fermi Large Area Telescope (Fermi-LAT) has recently detected γ-ray emission from active galactic nuclei (AGN) that do not show clear evidence for optical blazar characteristics or have jets pointing away from the observer (nonblazar AGNs). These are interesting γ-ray emitters providing an alternative approach to studying high energy emission processes.
Aims. This paper investigates the spectral and temporal properties of γ-ray emission from nonblazar AGNs using the recent Fermi-LAT observational data.
Methods. The data collected by Fermi-LAT during 2008–2015, from the observations of 26 nonblazar AGNs, including 11 Fanaroff–Riley Type I (FRI) and ten FRII radio galaxies and steep spectrum radio quasars (SSRQs) and five narrow line seyfert 1s (NLSy1s) are analysed using the new PASS 8 event selection and instrument response function. Possible spectral changes above GeV energies are investigated with a detailed spectral analysis. Light curves generated with normal and adaptive time bins are used to study the γ-ray flux variability.
Results. Non-blazar AGNs have a γ-ray photon index in the range of 1.84–2.86 and a flux varying from a few times 10−9 photon cm−2 s−1 to 10−7 photon cm−2 s−1. Over long time periods, the power law provides an adequate description of the γ-ray spectra of almost all sources. Significant curvature is observed in the γ-ray spectra of NGC 1275, NGC 6251, SBS 0846 + 513, and PMN J0948 + 0022 and their spectra are better described by log parabola or by the power law with exponential cut-off models. The γ-ray spectra of PKS 0625-25 and 3C 380 show a possible deviation from a simple power-law shape, indicating a spectral cut-off around the observed photon energy of Ecut = 131.2 ± 88.04 GeV and Ecut = 55.57 ± 50.74 GeV, respectively. Our analysis confirms the previous finding of an unusual spectral turnover in the γ-ray spectrum of Cen A: the photon index changes from Γ = 2.75 ± 0.02 to 2.31 ± 0.1 at 2.35 ± 0.08 GeV. In the Γ−Lγ plane, the luminosity of nonblazar AGNs is spread in the range of (1041–1047) erg s−1, where those with the lowest luminosity are FRI radio galaxies (but typically appear with a harder photon index) and those with the highest luminosity have are SSRQs/NLSY1s (with softer photon indexes). We confirm the previously reported short-timescale flux variability of NGC 1275 and 3C 120. The γ-ray emission from NLSY1s, 1H 0323 + 342, SBS 0846 + 513, and PMN J0948 + 0022 is variable, showing flares in short scales sometimes accompanied by a moderate hardening of their spectra (e.g., for MJD 56146.8 the γ-ray photon index of SBS 0846 + 513 was Γ = 1.73 ± 0.14). Non-blazar AGNs 3C 111, Cen A core, 3C 207, 3C 275.1, 3C 380, 4C + 39.23B, PKS 1502 + 036, and PKS 2004-447 show a long-timescale flux variability in the γ-ray band.
Key words: galaxies: active / galaxies: jets / gamma rays: galaxies / radiation mechanisms: non-thermal
© ESO 2018
1 Introduction
Recent observations in the high energy (HE; 100 MeV < Eγ < 100 GeV) γ-ray band show that the extragalactic γ-ray sky is dominated by the emission from active galactic nuclei (AGN) of different types. The majority of detected sources are blazars (BL Lacertae objects; BL-Lacs) and flat-spectrum radio quasars; FSRQs), an extreme class of AGNs with jets forming a small angle with respect to the line of sight, which makes their emission strongly Doppler-boosted (Urry & Padovani 1995). Blazars are known to emit electromagnetic radiation in almost all frequencies that are currently being observed, extending from radio to very high energy (VHE; >100 GeV) γ-ray bands. Their broadband spectra are mainly dominated by the nonthermal emission from a relativistic jet pointing toward the observer. This nonthermal emission is characterized by variability in all observed energy bands with different variability timescales ranging from years down to a few minutes. The shortest variability timescales are usually observed in the HE and VHE γ-ray bands, for example, the rapid changes of the γ-ray flux of PKS 2155-304, IC 310, PKS 1510-089, 3C 454.3, 3C 273, and PKS B1222 + 216 (Aharonian et al. 2007; Aleksic et al. 2014; Brown 2013; Foschini et al. 2011b, 2013; Saito et al. 2013; Nalewajko 2013; Hayashida et al. 2015; Rani et al. 2013; Ackermann et al. 2016b). This implies that the emission is produced in a very compact region, which provides a unique chance to investigate the jet structure and emission from subparsec regions.
Besides blazars, the γ-ray emission from other types of AGNs, for example, those which do not show clear evidence of optical blazar characteristics or have jets pointing away from the observer (nonblazar AGNs), also have been detected. These sources were not considered as favored GeV emitters because the nonthermal emission from their jets is less Doppler-boosted. After the launch of the Fermi Large Area Telescope (Fermi-LAT), several nonblazar AGNs (mostly radio galaxies) were detected already in the first year of observations (Abdo et al. 2010d, 2009a,b, 2010b). This provided a chance to investigate also the emission from extended non-boosted regions, moderately relativistic plasmas, and other components.
Analyzing the Fermi-LAT data accumulated during the first fifteen months of observations of nonblazar AGNs (including seven Fanaroff-Riley Type I (FRI) radio galaxies (Fanaroff & Riley 1974) and four FRII radio sources consisting of two FRII radio galaxies and two steep spectrum radio quasars SSRQs), Abdo et al. (2010c) showed that their average γ-ray spectral indexes are comparable, but they are somewhat less γ-ray –luminous than their parent population of BL Lacs and FSRQs. Despite the fact that a few nonblazar AGNs had been detected, which prevented extensive population studies, the observations of individual sources provided new and interesting results. Most interesting is perhaps the detection of γ-ray emission from the lobes of the Centaurus A (Cen A) and Fornax A (Abdo et al. 2010a; Ackermann et al. 2016a) radio galaxies. In the case of Cen A, the emission extends up to ≈3 GeV, with a soft photon index of Γ ≃ 2.6, and its flux makes more than half of the total source emission (Abdo et al. 2010a; Yang et al. 2012). Instead, the γ-ray emission from the lobes of Fornax A has a power-law photon index of Γ ≃ 2.0 and extends up to 20 GeV. It illustrates that the bipolar or quasi-symmetrical structures in the radio maps around almost all the radio galaxies can be potential sources of γ-rays.
The γ-ray spectra of some radio galaxies appeared with interesting features above several GeV. For example, during the γ-ray flaring activity of NGC 1275 in April–May 2009, a hysteresis behavior in the flux versus photon index plane was observed (Kataoka et al. 2010), when the γ-ray photon index hardened from Γ ≃ 2.2 to Γ ≃ 2.0. Next, during its major γ-ray flares of October 2015 and December 2016–January 2017, in the flux versus photon index plane the spectral evolution followed correspondingly a counter clockwise and a clockwise loop inferred from the light curve generated by an adaptive binning method (Baghmanyan et al. 2017). Another example is the second component in the γ-ray spectrum of the Cen A core emission; at Eb ≃ (4.00 ± 0.09) GeV the photon index changes from Γ 1 = 2.74 ± 0.03 to Γ 2 = 2.09 ± 0.20 (Sahakyan et al. 2013).
The multiwavelength observations of two well-known radio galaxies, 3C 111 and 3C 120, which show superluminal apparent motions in their radio jets, provided some clue to the localization of the emitting region. From 2008 to 2010, 3C 111 had only occasionally been detected in the HE γ-ray band. It was bright at the end of 2008 and faint for the rest of the time (Grandi et al. 2012). These bright periods in the γ-ray band coincide with the millimeter-optical-X-ray outburst, suggesting cospatiality of the events, which allowed for the localization of the γ-ray dissipative zone at a distance of about ~0.3 pc from the black hole in a compact region confined within ~0.1 pc (Grandi et al. 2012). Similarly, very long baseline interferometry (VLBI) and very long baseline array monitoring of 3C 120 reveal that its γ-ray activity is accompanied by radio and millimeter core brightening followed by the ejection of a superluminal knot (Casadio et al. 2015; Tanaka et al. 2015). Casadio et al. (2015) showed that γ-rays are detectedonly when the components are moving in a direction closer to our line of sight. The analysis of γ-ray events detection and superluminal components ejection periods shows that the γ-ray emission region is within ~0.13 pc from the millimeter VLBI core Casadio et al. (2015).
The origin of the γ-ray emission from nonblazar AGNs is another puzzling problem. In the case of blazars, the fast variability indicates the emission is produced in a compact region of the jet, which narrows the range of possible emission mechanisms. For some nonblazar AGNs, their jets are less Doppler-boosted, thus the γ-ray emission from other potential sites (e.g., moderately relativistic outflows, radio lobes, accretion regions) can be detected as well, making exact theoretical modeling of the origin of emission harder. Even when the emission is most likely produced in a compact region of the jet (e.g., Cen A core Abdo et al. 2010d, M 87 Abdo et al. 2009b, and NGC 1275 Abdo et al. 2009a), the most popular one-zone synchrotron/synchrotron self Compton (SSC) model clearly fails to explain the observed multiwavelength properties. More complicated models, such as multizone (Lenain et al. 2008) or structured jet (Tavecchio & Ghisellini 2008; Janiak et al. 2016; Tavecchio & Ghisellini 2014), based on different assumptions should be employed to explain the observed data properly. New and high-quality data are still needed to fully understand the origin of multiwavelength emission from nonblazar AGNs.
We note that the emission from some nonblazar AGNs extends up to the VHE γ-ray band, allowing them to be detected by the current generation of ground–based detectors. The observations of nonblazar AGNs in the MeV/GeV (HE) and >GeV (VHE) bands allowed to examine the nonthermal emission processes in the jets of AGNs, which are not strongly affected by Doppler boosting. Up to now only the spectra of Cen A, M 87, NGC 1275, and PKS 0625-35 have been measured in the MeV/GeV and TeV bands. The recent simulations show that at least eight new nonblazar AGNs will be detected by Cherenkov telescope array (CTA) at ~ 10 σ under the assumption of a straight extrapolation of the Fermi-LAT -measured power-law spectra in the CTA energy range (Angioni et al. 2017). In light of this, it is important to investigate the nonblazar AGNs’ γ-ray spectra above ~GeV, which now can be done with much improved statistics than before, considering i) that the Fermi-LAT data from longer periods of observation are collected and available and ii) there has been a recent update of the event-level analysis from PASS7 to PASS8. Moreover, using longer periods, it will be possible to study the γ-ray flux variability in both long and short timescales. This is crucial for theoretical modeling and distinguishing between compact and extended emission regions. This has motivated us to have a new look at the γ-ray emission from nonblazar AGNs.
In this paper we report on a detailed analysis of the γ-ray emission from 27 nonblazar AGNs that are included in the third catalog of AGNs detected by Fermi-LAT (Ackermann et al. 2015; Sect. 2). In Sect. 3, the Fermi-LAT observations and the data reduction procedure are described. The results of the analysis are given in Sect. 4. The discussions and conclusions are presented in Sects. 5 and 6, respectively.
2 Sources
The majority of AGNs detected by Fermi-LAT are blazars, FSRQs, and BL Lacs, and the number of unknown-type blazars is almost the same as that of FSRQs (~460; Ackermann et al. 2015). Only a very small fraction of the total sample (2%) are nonblazar AGNs, including fourteen radio galaxies, six SSRQs, one compact steep-spectrum quasar (CSSs), five narrow line seyfert 1s (NLSy1s), and five other AGNs. From this list, the other AGNs show spectral energy distributions (SEDs) typical for radio-loud compact-core objects, but data are lacking to be more specific about their classes, thus we have excluded them from our sample. Other sources have well-established classifications and/or have a well evaluated optical spectrum (with clear evidence for a presence or lack of emission lines) and some of them are also related to blazars in the unification scenario proposed for radio-loud AGNs; for example, FRIs are the parent population of BL Lacs, while FRIIs are linked with FSRQs (Urry & Padovani 1995). We included all these objects in our source sample, that is, AGNs with relativistic jets which are not blazars, and we refer to them collectively as nonblazar AGNs. Even if some of these sources might have different jet properties (e.g., the jets of 3C 111 and 3C 120 with superluminal apparent motions, or the jets of some objects with a smaller but still larger viewing angle than that of blazars), we did not exclude them from our source sample to have a general view of the comparison of γ-ray emission characteristics of blazar and nonblazar objects.
The radio galaxies detected in the γ-ray band so far can be subdivided into two morphological types, FRI and FRII (Fanaroff & Riley 1974), according to their radio luminosities. FRIs have a typical luminosity of < 1041erg s−1 (at 178 MHz) while that of the luminous FRIIs is >1041erg s−1 (at 178 MHz). FRIs have slower, more turbulent and less collimated jets, while FRIIs have powerful collimated jets (often only one is visible), which terminate in well-defined lobes with prominent hot spots. An example of an FRI is the nearby radio galaxy Cen A, and Pictor A with its peculiar jet is an example of an FRII. Increasingly aligned versions of FRIIs are SSRQs, which are powerful radio sources with large-scale radio structures and which appear at intermediate angles between FRIIs and FSRQs. SSRQs are sometimes classified as CSS quasars, since most of the radio flux is emitted within galactic scales (< 10 kpc) rather than at scales of hundreds of kiloparsec (Gelderman & Whittle 1994). Their radio structure on milliarcsec scales is similar to the morphology of a large radio source with lobes, hot spots, and jets; because of this similarity and the observed high radio power, these sources are thought to be the precursors of large radio galaxies observed at the early stage of their expansion (Fanti et al. 1995; O’Dea & Baum 1997). In the third catalog of AGNs detected by LAT, only 4C +39.23B has been classified as a CSS quasar although SSRQs 3C 286 and 3C 380 also have characteristics similar to CSSs.
Recently, NLSy1s have also been classified as γ-ray emitters (Abdo et al. 2009d). NLSy1s are AGNs with optical spectral properties similar to those of Seyfert 1 galaxies, except for having narrow Balmer lines and strong optical FeII lines (Osterbrock & Pogge 1985). NLSy1s exhibit strong X-ray variability, steep X-ray spectra, relatively high luminosity, and a substantial soft X-ray excess (Gallo 2006). These characteristics point to systems with a central black hole with smaller mass (106 –108 M⊙), and higher accretion rates (close to or above the Eddington limit). Up to now it is not clear whether or not the jets of NLSy1s make a small angle to the observer’s line of sight, however, they are very bright and interesting γ-ray emitters. Including them in our sample allows us to compare their γ-ray spectra, flux, luminosity, and other features with those of radio galaxies and blazars (aligned and not aligned cases), which facilitates the study of their jets.
In our sample of nonblazar AGNs we did not include Fornax A and IC 310. In the first source the γ-rays are associated with its radio lobes (Ackermann et al. 2016a), while the second is most likely a BL Lac (Kadler et al. 2012). In addition to the nonblazar AGNs from Ackermann et al. (2015) we also added 3C 120, as several different groups have independently reported on the detection of constant γ-ray emission from it (Sahakyan et al. 2015; Casadio et al. 2015; Tanaka et al. 2015). Therefore there are in total 27 nonblazar AGNs considered in our study (see Table 1).
3 Fermi-LAT data analysis
The LAT on board the Fermi satellite is a pair-conversion γ-ray telescope that observes photons with energies between 20 MeV and 300 GeV. Launched on June 11 2008, it is in the default “all-sky-survey” mode optimized to provide a relatively uniform coverage of the entire sky every 3 hours. Further details of the instrument are described in Atwood et al. (2009) and references therein.
3.1 Dataextraction
The data set used here was collected during the first seven years of Fermi-LAT operation, from August 4 2008 to August 4 2015. We selected only events within a maximum zenith angle of 90° to reduce the Earth limb γ-rays and use the recommended filter string “DATA_ Qual >0 && LAT_ CONFIG==1” in gtmktime. The standard Fermi Science Tools v10r0p5 software package released on May 18 2015, available from the Fermi Science Support Center1 is used withthe P8R2_ SOURCE_ V6 set of instrument response functions. Only events with a higher probability of being photons (evclass=128 evtype=3) have been used within the energy range from 100 MeV to 300 GeV.
The photons from a circular region with a radius of 10° around each source under consideration were used, except for 3C 207, M 87, PKS 1502 + 036, PKS 2004-447, and 1 H 0323 + 342, around which a region with a radius of 12° was used fora better representation of the region of interest (RoI). By selecting different radii of the RoI we ensure that the selected RoIs are an accurate representation of the observation. The photons are binned with the gtbin tool with a stereographic projection into pixels of 0.1° ×0.1° and into 35 equal logarithmically-spaced energy bins. The model for which we calculated the likelihood includes a combination of point-like and diffuse sources within a 14° × 14° square RoI (16.9°× 16.9° when the radius of the circular region is 12°). The model file for each source is created using the Fermi-LAT third source catalog (Acero et al. 2015; 3FGL) where all sources falling between the RoI and RoI + 5° region are included in it. The Galactic and diffuse background models gll_ iem _ v06 and iso_P8R2_SOURCE_V6_v06 have been used, which are currently recommended by the LAT team. The normalization of background models as well as fluxes and spectral indexes of the sources within the RoI are left as free parameters in the analysis, while for the sources outside the RoI the spectral slopes and normalizations were fixed to the values given in the 3FGL catalog.
3.2 Spectral analysis
In order to find the best matches between spectral models and events, the binned likelihood analysis is performed with the gtlike tool. The detection significance of each source is quantitatively estimated using the test statistics (TS) defined as TS = 2(log L−log L0), where L and L0 are the likelihoods with an additional source and null hypothesis (Mattox & Bertsch 1996). The spectra of the considered sources are modeled with a power-law (PL) model in the form of
 (1)
(1)
where the normalization N0 and γ-ray photon index Γ are considered as free parameters. If deviation from the PL model is found, then a more complex power law with exponential cut-off (PLEC) model in the form of
 (2)
(2)
is used, where N0, Γ, and Ec are free parameters. First we fix the value of β = 1, then consider it also as a free parameter. Since the log-parabolic (LP) spectral shape gave a better modeling for the spectra of some blazars (Massaro et al. 2006), we consider also the LP model in the form of
 (3)
(3)
where N0, α, and β are free parameters. Different models are compared using a log likelihood ratio test: the TS is twice the difference in the log likelihoods and its probability distribution can be approximated by a χ2 distribution.
The spectra of each source are calculated by separately running gtlike for smaller energy intervals equal in logarithmic space. In each bin the flux is estimated by fitting the PL model with the spectral slope fixed at the value obtained by the fit in the entire energy range and only the bins with TS ≥ 4 are considered. Using the data accumulated for a longer time than that used in 3FGL can result in new γ-ray sources in the RoI, which are not properly accounted for in the model files. In order to probe for additional sources, a TS significance map on a square grid with 0.1° × 0.1° spacing that covers the entire RoI was created using the best-fit model. If there were excess hot-spots with TS > 25 we sequentially added a new point source with a conventional spectral definition (PL) and performed a binned likelihood analysis with gtlike.
3.3 Temporal analysis
The γ-ray light curves are calculated by repeating the same analysis for shorter time periods. In the model file obtained from the whole-time analysis, the photon indexes of all background sources are fixed to the best guess values in order to reduce the uncertainties in the flux estimations, but the normalization of sources within the RoI are free to vary. The PL slope of each source being analyzed is first fixed and then allowed to vary in the fit. Since no variability is expected for the underlying background diffuse emission, we fixed their parameters to the average values obtained in the seven-year analysis.
The minimal time interval used for light-curves calculation has been chosen so that the period when the source was detected by Fermi-LAT corresponds to the largest fraction of the total bins, considering the periods when TS > 4. For some sources, pure statistics did not allow us to investigate the variability in shorter than 6-month bins, while for bright sources the light curves with denser time sampling are considered. In order to identify whether the γ-ray emission is variable or not, we constructed a variability index from the value of the likelihood in the null hypothesis that the source flux is constant across the considered period, and the value under the alternate hypothesis that the source is variable (Nolan et al. 2012). If the null hypothesis is correct, the variability index is distributed as χ2 with N − 1 degrees of freedom, where N is the number of bins used in the light curves. The source is considered variable when the variability index is equal to or greater than the threshold value of the 99% confidence level in a χ2 distribution with N − 1 degrees of freedom (e.g., 115.88 and 16.81 for the light curves with a month and a year timescales, respectively). This is a commonly accepted methodology used to identify variable sources in the Fermi-LAT catalogs (e.g., Nolan et al. 2012; Ackermann et al. 2015; Acero et al. 2015). In order to double check the results, possible variation is also investigated by using a simple χ2 test following Abdo et al. (2010e).
At regular (fixed) time binning, the use of long bins will smooth out the fast variations during bright periods, while using short bins might result in many upper limits during the low-activity periods, which prevents variability studies. Thus, we also generate light curves with the help of the adaptive binning method (Lott et al. 2012). Although this method has been developed for blazar studies, it can be applied to radio galaxies as well. In the adaptive binning method the bin width is adjusted by requiring a constant relative flux uncertainty, which produces longer time intervals during lower flux levels and narrower bins when the source is in a high state. This method allows us to obtain the maximum possible information about the flux variation.
In the adaptive binning method, each time bin of the light curves are with constant uncertainties of the fluxes. In principle, the flux can be calculated above any energy, but above the optimum energy of Eopt the accumulation times necessary to fulfill the required conditions (e.g., uncertainty) are the shortest relative to other choices of energy. The Eopt depends on the signal-to-background ratio and is calculated using the PL slope (Γ) and the flux obtained in the 0.1–300 GeV interval (see the appendix of Lott et al. 2012). For each source, adaptive binning light curves with 15% and 20% uncertainties are generated.
4 Results
Of the 27 nonblazar AGNs studied here, 26 are detected with TS > 25. The only exception is TXS 0348+013, which appeared with TS ≃ 14. The results from the current data analysis are summarised in Table 1. For each source, the class, distance, γ-ray photon index (Γ), flux (Fγ) and luminosity (Lγ), the detection significance ( ), and the energy of the highest-energy events with their detection times are presented. Our results have been verified by: i) carrying out analysesin two different ways: first by a standard procedure as suggested by the Fermi-LAT collaboration 2 and then by using the Fermipy python package 3, and ii) by comparing the results with those previously reported (from 3FGL).
The results presented here are consistent with those reported in Ackermann et al. (2015) but with reduced uncertainties and a higher detection significance. The majority of the sources were detected with ≥ 10σ, which allowed us to perform spectral studies above 1 GeV as well. NGC 1275 was detected with the highest detection significance of 267.4σ, while 3C 303 and NGC 2484 were still detected at the threshold limit with 5.2σ and 5.6σ, respectively, because these sources were mostly un-detected by Fermi-LAT during the last years of the considered period.
As canbe seen from Table 1, the γ-ray photon index of nonblazar AGNs varies from Γ = 1.84 to 2.86. The hardest photon indexes of Γ ≃ 1.84 ± 0.17 and Γ ≃ 1.89 ± 0.04 have been found for TXS 0331+3915 and PKS 0625-35, respectively, while the softest spectrum was observed for 1H 0323+342, Γ ≃ 2.86 ± 0.04. Interestingly, 3C 264, NGC 1275, M 87, NGC 1218, and 3C 303 were detected with Γ ≃ 2.0 − 2.1, which corresponds to a nearly flat spectrum in the νFν(erg s−1) representation. The brightest sources, Cen A and NGC 1275, have a flux of ≥ 10−7 photon cm−2 s−1 and the faintest source 3C 303 has (1.44 ± 0.75) × 10−9 photon cm−2 s−1.
Among FRIs, PKS 0625-35 (dL ≈ 243.7 Mpc) is themost distant source detected so far, while the other FRIs are mostly at dL ≤ 200 Mpc. Except for Cen A and NGC 1275, which are bright due to their proximity, as the flux of FRIs is relatively weak (a few times exceeding the Fermi-LAT sensitivity of ≈ 1.9 × 10⁻¹⁰ photon cm−2 s−1 at 10 GeV), we do not expect to detect FRIs that are much farther than those currently being observed. On the contrary, the luminous FRIIs, SSRQs (CSS), and NLSy1s are detected at much larger distances –z > 0.1. For instance, the most distant nonblazar AGNs detected in the γ-ray band are 3C 286 and 4C +39.23B at z = 0.85 and z = 1.21, respectively. If the observed luminosities are typical for FRIIs, SSRQs (CSS), and NLSy1s, in principle more distant sources can still be detected (e.g., the γ-ray emission from 4C +39.23B would still be detected by Fermi-LAT even if the source is at z ≃ 1.84). NLSY1s detected in the γ-ray band are at z ≃ (0.2−0.6) (except the nearby 1H 0323+342 at z = 0.061), which is notsurprising, considering their powerful jets.
The results presented in Table 1 are shown in Fig. 1, the left panel of which shows the γ-ray photon index (Γ) versus flux (Fγ [>100 MeV]) estimated from the PL fit. It is evident that the considered sources have different properties as they are well separated in the Γ − Fγ plane. For example, FRIs have a harder γ-ray photon index, the mean being Γm ≃ 2.22, and a γ-ray flux ranging from ≃1.5 × 10⁻⁹ ×photon cm−2 s−1 to ≃3.6 × 10⁻⁸ ×photon cm−2 s−1. Among FRIs, only Cen A and NGC 1275 show systematically different properties. In the case of Cen A, the photon index and the flux are mostly defined by the low energy component (see the next section), but when using those of the second component (Γ = 2.31 ± 0.1 and (9.16 ± 0.68) × 10−10 photon cm−2 s−1), it fits well into thecommon properties of FRIs. NGC 1275 is a unique and particularly bright radio galaxy, so it is not a surprise that it demonstrates quite different properties. The FRIIs and SSRQs have rather similar properties and occupy a narrow area on the Γ − Fγ diagram: the γ-ray photon index is (2.3–2.7) with the mean being Γm ≃ 2.58 and a flux of (0.9 − 4) × 10−8 photon cm−2 s−1. Only 3C 303, with Γ = 2.04 ± 0.19, is out of the mentioned area, showing properties more characteristic of FRIs. Despite using the data accumulated over 7 years, this source is detected only with 5.2σ, causing large uncertainties in the parameter estimation. For NLSy1s Γ > 2.3, which is more similar to FRIIs and SSRQs albeit their γ-ray flux is shifted to ≥ 10−7 ×photon cm−2 s−1. The bright source PMN J0948+0022 which, being located at a distance of 3.4 Gpc, appears with the same flux as the nearby Cen A (3.8 Mpc), but has a luminosity that is ~7 × 10⁵ times higher.
Even if the nonblazar AGNs considered here may have different jet properties (e.g., jet viewing angle, super luminal apparent motion), it is interesting to compare their γ-ray photon index and luminosity with those of blazars. The right panel in Fig. 1 shows the γ-ray photon index vs. luminosity of nonblazar AGNs and of those BL Lacs and FSRQs that are included in the third catalog of AGNs detected by Fermi-LAT (Ackermann et al. 2015). The γ-ray luminosity is estimated from the measured flux by
 (4)
(4)
where Emin = 100 MeV and Emax = 300 GeV. The luminosity distance (dL) is calculated by adopting the standard cosmological parameters of H0 = 70 km s−1Mpc−1, Ω m = 0.27, and Ω Λ = 0.73.
The previous studies of nonblazar AGNs reveal that in the Γ − Lγ plane FRIs and FRIIs occupy different regions, as do BL Lacs and FSRQs (Abdo et al. 2010c). In the case of blazars, it has been already shown that there is a well-defined boundary between BL Lacs and FSRQs. BL Lacs appear with Γ <2.2 and Lγ < 1047 erg s−1, whereas FSRQs have Γ > 2.2 and Lγ > 1047 erg s−1; the two blazar subclasses overlap at intermediate values of both spectral index and luminosity (Ghisellini et al. 2009). It has been suggested that this division is of a purely physical origin, that is, in BL Lacs the jet propagates in a medium where the external radiation field is absent or very weak, so that the electrons cool less but can be accelerated to VHEs, so that low luminosity and a harder electron and photon indices are expected. In FSRQs, the emitting electrons will efficiently cool down and reach only moderate energies, therefore they will appear as luminous sources but with a soft γ-ray photon index. Interestingly, a similar division is also noticeable for FRIs and FRIIs, albeit shifted to lower luminosities (Fig. 1, right panel; the blazars have higher luminosity due to Doppler boosting). The γ-ray luminosity of most of the FRIs is Lγ ≤ 3 × 1044 erg s−1 and the photon index is Γ ≤ 2.3. Likewise, forFRIIs Lγ ≥ 3 × 1044 erg s−1 and Γ >2.3. SSRQs and NLSy1s occupy the area beyond Γ > 2.3 and Lγ > 1045 erg s−1 and are clearly separated from FRIs and FRIIs, except for 1H 0323+342, the nearest NLSy1 to be detected so far in the γ-ray band, which has a lower luminosity of Lγ < 1045 erg s−1. The difference in γ-ray luminosity in different source classes is in good agreement with the unification theories: less luminous FRIs are followed by FRIIs and then bySSRQs, the most aligned version of FRIIs.
For thesources studied here it is interesting to compare the energy released in the γ-ray band with the capability of the central source (Eddington accretion power). It would be more reasonable to compare the γ-ray luminosity in the proper frame of the jet ( ), but it requires us to make different assumptions to estimate unknown Γ bulk. Considering that Γ bulk is usually not very high for nonblazar AGNs, it is reasonable to use Lγ. We did not find black hole masses for Cen B, 3C 221, PKS 1203+04, TXS 0331+3915, and 4C +39.23B, while for other sources the values available in the literature have been used. A common feature for all FRIs is that the intrinsic γ-ray luminosity corresponds to only a small portion of the Eddington accretion power: Lγ ∕LEdd ≤ 10−4. For example, M 87 hosts a super massive black hole with an enormous mass of (6.6 ± 0.4) × 109 M⊙ (Gebhardt et al. 2011) but Lγ∕LEdd ≃ 9.6 × 10⁻⁷ implying that in the γ-ray band only a very small fraction of the source capability is realized. Similarly, Lγ ∕LEdd ≃ 3.0 × 10⁻⁵ for the nearby Cen A and Lγ∕LEdd ≃ 9.1 × 10⁻⁴ for the distant PKS 0625-35. The only exceptions are 3C 120 and NGC 1275, where Lγ ∕LEdd ≃ 5 × 10⁻³, which is not surprising considering these are the only FRIs where the γ-ray emission is characterized. by rapid changes. For FRIIs and SSRQs, Lγ ∕LEdd = 10−3–10−4 and 0.2–0.4, thus the total available power is very efficiently converted to the emission in the γ-ray band. Interestingly, due to the small black hole masses in NLSY1s, Lγ∕LEdd = (2–4), which can be even higher during the flaring periods, similar to blazars, where also such “super-Eddington” regimes (but with larger Lγ ∕LEdd ratio) are observed (e.g., Bonnoli et al. 2011).
Table 1 shows the highest energy of the events with a higher probability of being associated with the sources and of having less angular separation, along with their detection times, computed using the gtsrcprob tool. The highest-energy photons of 258.8, 221.5, 111.0, and 107.9 GeV were detected from M 87, NGC 1275, Cen A, and PKS 0625-35, respectively. Except for Cen A, all the other sources have comparably hard photon indexes, so their spectra extend to HEs, allowing us to detect photons above 100 GeV. Moreover, when the highest energy photons from M 87 and PKS 0625-35 were detected, their γ-ray spectra were unusually hard, 1.50 ± 0.20 and 1.74 ± 0.18, respectively.For the other sources, due to the soft PL indexes, the photon energies are limited to < 50 GeV; the only exception is 3C 380 from which photons with 66.7 GeV have been detected. Even thoughNLSY1s are powerful γ-ray sources, dueto the break in their spectra around several GeV, the detected photon energies are mostly below 10 GeV, except for 1H 0323+342 with 16.5 GeV.
Results of the Fermi-LAT observation of nonblazar AGNs from August 4 2008 to August 4 2015.
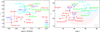 |
Fig. 1 Left panel: flux (E > 100 MeV) versus photon spectral index of FRIs, FRIIs, SSRQs, and NLSy1s. Right panel: photon spectral index versus γ-ray luminosity of the considered sources as compared with similar properties of blazars (light blue ellipse for FSRQs and light red for BL Lacs). Inboth plots, FRIs, FRIIs, SSRQs, and NLSY1s are shown with red, blue, cyan, and green colors, respectively. |
5 Discussion
The γ-ray spectra of most of the sources studied here are described significantly better by a PL. However, the γ-ray spectra of some bright sources that have been detected with a higher significance show a tendency to have a cut-off/break above 1 GeV. In addition, variability studies of nonblazar AGNs can shed light on the physical processes in action, such as particle acceleration and emission mechanisms, the origin of brightening(s), and the structure and location of the emission region(s). Below, the nonblazar AGNs detected by Fermi-LAT are discussed individually or by each set of objects that behave in a similar fashion. The spectra and light curves are presented in Figs. 2 and 3 and the main parameters are in Tables 1 and 2.
NGC 1275. The γ-ray spectrum is shown in Fig. 2a. The spectrum starts to steepen around ≃ (1–10) GeV and more complex LP and PLEC models are used to fit the data. The log likelihood ratio test shows that the PLEC modeling when β =0.43 ± 0.04 is preferred over the simple PL, with a significance of 5.8σ. The PLEC model is shown in Fig. 2b together with LP and PLEC (β = 1) models.
Among the considered sources, NGC 1275 is unique as the flux variation in timescales as short as a day can be investigated. Recently, we showed that during the major γ-ray flares of NGC 1275 in December 2016 and January 2017, the source reached a daily peak flux of (2.21 ± 0.26) × 10−6 photon cm−2 s−1 and had an e-folding time as short as 1.21 ± 0.22 h. Even if it was known that the γ-ray emission from this source varied on month (Abdo et al. 2009a; Kataoka et al. 2010) and sub’ week timescales (Brown & Adams 2011), such rapid γ-ray flux variations had never been previously observed from any radio galaxy in the γ-ray band. The light curve with normal (7-day) and adaptive time binning (assuming 20% uncertainty) is shown in Fig. 3a. The γ-ray light curve appears to be quite a complex one, with many peaks and flaring periods. The adaptively-binned light curve shows that in the active states the required uncertainty is reached on subday scales, which once again confirms the short-scale variability of this source. Also, after MJD 56000 (2012) the source is mostly in a bright state, which resulted in the increase of the average flux level (Fig. 3a).
3C 120. The light curve with 90-day binning (see the insert in Fig. 3b) shows that up to MJD 56900 the source flux is below the Fermi-LAT sensitivity threshold and is mostly undetectable (only upper limits). Afterwards, the γ-ray flux increased and it was continually detected by Fermi-LAT. More dramatic changes in shorter timescales can be seen on the adaptively-binned light curve shown in Fig. 3b. The data collected from MJD 54682 (August 4 2008) up to MJD 56919.31 (September 19 2014) are necessary to reach the 20% uncertainty in the first bin, while it took a shorter time afterwards. The most dramatic increase in the γ-ray flux was observed on April 24 2015 when within 19.0 min the flux reached (7.46 ± 1.56) × 10−6 photon cm−2 s−1 with Γ = 2.29 ± 0.21 and 11.2σ detection significance. Then the flux slowly decreased and the data collected within ten to 35 days were enough to reach 20% uncertainty. A more detailed analysis of the origin of emission using multiwavelength data is presented in Zargaryan et al. (2017).
Cen A core. The changes observed in the γ-ray spectrum are shown in Fig. 2b. The presence of the unusual break (Sahakyan et al. 2013; Brown et al. 2017) is confirmed using the Fermi-LAT data accumulated for a longer period. In the energy range of 0.1–300 GeV, the broken PL with the break energy 2.35 ± 0.08 GeV is preferred over the PL at ≃5.0σ level. The energy range of 0.1–300 GeV was divided into (0.10–2.35) GeV and (2.35–300) GeV subintervals, and the likelihood analyses were re-run. The first component with Γ = 2.75 ± 0.02 and a photon flux of (1.62 ± 0.04) × 10−7 photon cm−2 s−1 is detected with 71.5σ and shown with black color in Fig. 2b while the red line shows the second component with Γ = 2.31 ± 0.1 and (9.16 ± 0.68) × 10−10 photon cm−2 s−1 detected with 25.7σ. This break is unusual in that the spectrum gets harder instead of getting softer, while typically the opposite occurs. This is a unique case and has never been yet observed in the γ-ray spectra of other AGNs. This hardening could be caused by the contribution of an additional HE component beyond the common SSC jet emission.
NGC 6251. Detected with 32.0σ, its spectrum extends up to ≃(60–70) GeV, but the PL model fails to explain the γ-ray data above 1 GeV. The results of fitting with alternative models, LP and PLEC (β = 1), are shown in Fig. 2c. The data are better explained by LP, with α =2.29 ± 0.05 and β =0.1 ± 0.03. Among the considered radio galaxies, only the spectrum of NGC 6251 is described by LP, indicating that perhaps a different process is responsible for the particle acceleration. As shown by Massaro et al. (2006), the γ-ray spectra well-described by the LP are formed when the jet electrons are accelerated stochastically. Instead, the PLEC is formed within diffuse shock acceleration theories and can be interpreted as the emission from accelerated particles, where the cut-off is due to: i) escape of the highest energy particles, ii) limitation of the acceleration processes, or iii) radiative losses.
PKS 0625-25. This is one of the radio galaxies detected in the VHE γ-ray band (Dyrda et al. 2015). Its γ-ray photon index, Γ =1.89 ± 0.04, is unusually harder than those of other radio galaxies. Around 100 GeV, there is a hint of substantial deviation from PL (black curve in Fig. 2d), but the PLEC model, with Γ =1.83 ± 0.06 and E cut = 131.2 ± 88.04 GeV (Fig. 2d, red curve), is preferred over the simple PL only at the ~2σ level, so thePL cannot be rejected. However, the spectrum of PKS 0625-35 in the TeV band is softer, Γ TeV = 2.8 ± 0.5 (Dyrda et al. 2015), which strengthens the assumptions of the cut-off in the GeV band.
3C 380. Along with 3C 207, this is the first SSRQ detected by Fermi-LAT in the γ-ray band (Abdo et al. 2010c). Its γ-ray spectra can be described by PL with Γ = 2.43 ± 0.03 detected with ≈ 36.2σ, and its emission extends up to 300 GeV (Fig. 2e). We note an indication of deviation of the PL with respect to the data above 10s of GeV but the PLEC mode-ling with Γ = 2.36 ± 0.05 and Ec = (55.57 ± 50.74) GeV (Fig. 2e) is preferred over PL only at the level of ~1.4σ. Its γ-ray emission is variable in 30-day scales but the adaptively binned light curve shows that sometimes the flux increases also in short periods: for example, on MJD 55184.71 within 21.3 days the flux increased up to (8.45 ± 1.37) × 10−8 photon cm−2 s−1.
Noticeably different spectral and temporal properties are observed for the NLSY1s analyzed here. The spectra of PKS 1502+036 and PKS 2004-447 were better described by PL with steep Γ = 2.67 ± 0.04 and Γ = 2.63 ± 0.05 photon indexes, respectively. Their emission extends up to 10–30 GeV and is variable on long (e.g., 45- and 60-day) timescales. Instead, the γ-ray emission of 1H 0323+342, SBS 0846+513, and PMN J0948+0022 significantly increases over timescales of a day- or a few days (Abdo et al. 2009d; Paliya et al. 2014; D’Ammando et al. 2012, 2013; Abdo et al. 2009c; Foschini et al. 2011a). With the help of the light curves generated by the adaptive binning method, we report on flux variations and spectral changes over shorter timescales.
1H 0323+342. Its spectrum is steep, Γ = 2.86 ± 0.04, and the γ-rays are detected up to 10 GeV. There is a marginal evidence of a spectral curvature around 1 GeV (Fig. 2f) and both LP or PLEC (β = 1) models can better explain the observed data (blue and red curves in Fig. 2f, respectively). However, because of low statistics (~ 3.1σ) PL modeling cannot be excluded. For most of the time, the γ-ray flux of 1H 0323+342 did not much exceed the value averaged over the whole observational time (Fig. 3c). The adaptively-binned light curve calculated for 15% uncertainty shows several periods when the flux significantly increased (Fig. 3c). The most significant increase was observed on MJD 56534.3 when within 16.2 hrs the flux was as high as (1.98 ± 0.31) × 10−6 photon cm−2 s−1 and the photon index hardened to Γ = 2.22 ± 0.15. During this flare, the flux-doubling time was as short as 0.49 days, implying the emission is produced in a very compact region, ≃ 1.2 × 10¹⁵ × δ cm (Baghmanyan & Sahakyan 2018). After this rapid flare, the source again entered its quiescent state.
SBS 0846+513. Below ≃10 GeV its spectrum can be well described by a PL (Fig. 2g) with Γ =2.26 ± 0.02, which is thehardest photon index obtained for the selected NLSY1s. At higher energies, the PL model overpredictsthe observed data (Fig. 2g) suggesting a turn-over in the spectrum. Indeed, at 5.1σ the LP with α = 2.15 ± 0.03 and β = 0.09 ± 0.02 explains the data better statistically. A sequence of flares can be identified on the γ-ray light curve of SBS 0846+51 with 30-day and adaptive bins (20%) shown in Fig. 3d, though with a lower amplitude as compared with the flares of 1H 0323+342. The highest flux of (6.35 ± 1.12) × 10−7 photon cm−2 s−1 was observed on MJD 56145.6 and the active state lasted until MJD 56 146.8, when within 19.6 hours the flux was (4.15 ± 1.04) × 10−7 photon cm−2 s−1, but the photon index was significantly hard 1.73 ± 0.14. This is the hardest γ-ray photon index detected during the considered seven years and, interestingly, the highest-energy 16.5 GeV photon was also observed during this period. This hardening is most likely associated with the emission from the re-accelerated or fresh electrons, which produced also the observed highest-energy photon.
PMN J0948+0022. Its spectrum, measured in the narrow 0.1–10 GeV range, appeared with a significant curvature as shown in Fig. 2h. The comparison of LP and PL models yields a log likelihood ratio of 95.2, so the PL mode-ling can be rejected with a significance of 9.76σ. The LP model compared with the observed spectrum is shown in Fig. 2h (for parameters see Table 2). The γ-ray light curve with 15-day and adaptive bins (20%) shows that the source is alternatingly in its flaring or quiescent states (Fig. 3e). Several times, the source flux was above 10−6 photon cm−2 s−1 and during an extremely active state from MJD 56 290.96 to MJD 56 294.60, it reached a peak flux of (1.51 ± 0.31) × 10−6 photon cm−2 s−1 within 18.9 h, corresponding to an apparent isotropic γ-ray luminosity of Lγ ≈ 1.09 × 1048 erg s−1, which is typical for the brightest FSRQs. For most of the time the photon index is > 2.5, the hardest one being Γ = 2.13 ± 0.18. The observed rapid flux changes in intra-day scales and the amplitude of the increase once more show that in the γ-ray band NLSY1s behave in a similar way to blazars.
Sources with long timescale variability: The γ-ray emission from some sources varies within longer time periods as compared with NGC 1275 and 3C 120. For example, the low energy component of Cen A core emission is variable within 45 days, which confirms the marginal evidence reported in (Sahakyan et al. 2013). In the second emission component, there is an indication (at the limit) of a year and half-year scale variability, but because of limited statistics, however, no definite conclusion can be drawn. There is a hint of variability in the γ-ray light curves of M 87 and PKS 0625-35 with 60-day binning, but the statistics do not allow us either to confirm or explore it over shorter timescales. The previous observations of M 87 in the HE and VHE γ-ray bands have already suggested that it is in its quiescent state (Abdo et al. 2009b; Abramowski et al. 2012) while being active and repeatedly in the flaring state in 2005 (Aharonian et al. 2006; Albert et al. 2008; Acciari et al. 2009; Levinson & Rieger 2011). Interestingly, these sources are also the ones which have been detected in the VHE γ-ray band so far (Rieger 2017).
Among FRII/SSRQs/CSS, 3C 111, 3C 207, 3C 275.1, 3C 380, and 4C+39.23B are variable. The variability of 3C 111 is highly significant in the light curve with 60-day binning. For 3C 207 and 3C 275.1, the significance is still not high enough to confirm the variability over short timescales but the γ-ray emission is variable within a year. For 4C + 39.23B, in the light curves with 90-day and 60-day binning, the periods when the source was and was not detected by Fermi-LAT are comparable, therefore no definite conclusion can be made but the γ-ray emission is variable within a half-year period. Nevertheless, a short timescale activity around April 21 2011 was observed, when within 29.4 days the flux was (4.39 ± 0.85) × 10−8 photon cm−2 s−1 (as inferred from the adaptively-binned light curve).
The significance is still not high enough to search for γ-ray variability in the other sources studied here. It is interesting to highlight Cen B and NGC 6251 where the γ-ray emission is detected with high 18.5σ and 31.6σ significances, respectively.The constant flux assumption cannot be rejected when using light curves with short (few months) or long timesscales (half-year to a year). Although this does not allow us to rule out possible variability completely, this is interesting, since both have large scale structures, ~ 380 kpc for Cen B (Jones et al. 2001) and ~1.8 Mpc for NGC 6251 (Waggett et al. 1977), and in principle the γ-rays can be produced in these regions.
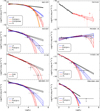 |
Fig. 2 Spectra of NGC 1275, Cen A core, NGC 6251, PKS 0625-35, 3C 380, SBS 0846+513, 1H 0323+342, and PMN J0948+0022 measured in the energy range from 100 MeV to 300 GeV, which showed deviation from the simple PL model above several GeV (see the text). The best fit models obtained with gtlike are depicted together with spectral points, which have been obtained by separately running gtlike for smaller energy intervals. The corresponding parameters are given in Table 2. |
Parameters of fitting with LP or PLEC models.
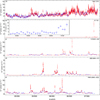 |
Fig. 3 Light curves of NGC 1275, 3C 120, 1H 0323+342, SBS 0846+513, and PMN J0948+0022. The light curves are calculated with the standard gtlike tool for normal (blue) and adaptively-binned (red) timescales. |
6 Conclusions
We investigated the γ-ray emission from nonblazar AGNs included in the third catalog of AGNs detected by Fermi-LAT using the Fermi-LAT data accumulated in 2008-2015. The sample consists of eleven FRI, three FRII, six SSRQ, one CSS, and five NLSy1 sources. We obtained the following results:
- i)
The γ-ray photon index of nonblazar AGNs changes within 1.84–2.86. The hardest photon indexes of Γ = 1.84 ± 0.17 and Γ = 1.89 ± 0.04 were obtained for TXS 0331+3915 and PKS 0625-35, respectively, and the softest for 1H 0323+342, Γ = 2.86 ± 0.04. The measured faintest flux is of the order of a few times 10−9 photon cm−2 s−1, while the flux from bright sources exceeds 10−7 photon cm−2 s−1. The farthest nonblazar AGN detected by Fermi-LAT is 4C +39.23B at z ≃ 1.21, with a γ-ray flux of (1.91 ± 0.19) × 10−8 photon cm−2 s−1.
- ii)
In the Γ−Fγ plane, the FRIs have a harder γ-ray photon index, with Γm ≃ 2.22 and a flux ranging from ≃ 1.5 × 10⁻⁹ ×photon cm−2 s−1 to 3.6 × 10⁻⁸ ×photon cm−2 s−1. The mean photon index of FRIIs and SSRQs shifts to a higher value of Γm ≃ 2.58 (i.e., softer spectra) and the flux to the range of (0.9–4) × 10−8 photon cm−2 s−1. With a γ-ray flux of ≥ 10−7 ×photon cm−2 s−1, the average photon index of NLSYs is similar to that of FRIIs and SSRQs with Γ > 2.3.
- iii)
In the Γ−Lγ plane we confirm the previous results from the analysis of a smaller sample of nonblazar AGNs. The γ-ray luminosity of most of the FRIs is Lγ < 3 × 1044 erg s−1 with Γ < 2.3, while for FRII Lγ > 3 × 1044 erg s−1 but Γ > 2.3. SSRQs and NLSy1s occupy the area beyond Γ > 2.3 and Lγ > 1045 erg s−1, which is more typical for FSRQs, and are clearly separated from FRIs and FRIIs. The ratio of apparent γ-ray luminosity to the Eddington accretion power is different for each class of objects considered here. This ratio is usually very small for FRIs (< 10−4), increasing for FRIIs/SSRQs (10−3–10−2), and exceeding unity for NLSY1s.
- iv)
The γ-ray spectra of most of the sources studied here are described significantly better by a PL. The spectra of NGC 1275, NGC 6251, SBS 0846+513, and PMN J0948+0022 deviate from PL significantly. The spectra of NGC 6251, SBS 0846+513, and PMN J0948+0022 are better modeled with LP, while thecurvature in the γ-ray spectra of NGC 1275 can be better described using PLEC (β free). There is a hint of possible cut-off in the spectra of 3C 380, PKS 0625-35, and 1H 0323+342, thoughthe current data does not allow us to reject the PL model. The unusual break in the spectrum of Cen A is confirmed, which shows that below and above 2.35 ± 0.08 GeV, thephoton index is Γ = 2.75 ± 0.02 and 2.31 ± 0.1, respectively.
- v)
New sources with variable γ-ray emission have been identified. Apart from the rapid and strong variability of NGC 1275 and 3C 120, periods of strong flux increase and short timescale variability are found for 1H 0323+342, SBS 0846+513, and PMN J0948+0022 using the light curves generated with an adaptive binning method. The γ-ray emission from 3C 380, 3C 111, Cen A core (low energy component), PKS 1502+036, and PKS 2004-447 varies within months, and there is an indication (at the threshold limit) of variability of the flux of PKS 0625-35 and M 87. The γ-ray flux of 3C 207, 3C 275.1 and 4C +39.23B varies within half-year or 1-year periods. The absence of γ-ray variability in Cen B and NGC 6251 is notable, which appeared to have been detected with a significance of 18.5σ and 31.6σ, respectively.
- vi)
The γ-ray emission from NLSy1s with their flares and peculiar multiwavelength properties makes them more similar to blazars. The γ-ray emission is variable, showing flares in short timescales along with a moderate hardening of their spectra. For example, on MJD 56 146.8, SBS 0846+513 was in its high state with a flux of (4.15 ± 1.04) × 10−7 photon cm−2 s−1 and with a significantly hard photon index of 1.73 ± 0.14. During the active state of PMN J0948+0022 from MJD 56 290.96 to MJD 56 294.60, the peak γ-ray flux was (1.51 ± 0.31) × 10−6 photon cm−2 s−1 within 18.9 h, which corresponds to an apparent isotropic γ-ray luminosity of Lγ ≈ 1.09 × 1048 erg s−1.
Acknowledgments
This work was supported by the RA MES State Committee of Science, in the frames of the research project No 15T-1C375. We thank the anonymous referee for constructive comments that significantly improved the paper.
References
- Abdo, A. A., Ackermann, M., Ajello, M., et al. 2009a, ApJ, 699, 31 [NASA ADS] [CrossRef] [Google Scholar]
- Abdo, A. A., Ackermann, M., Ajello, M., et al. 2009b, ApJ, 707, 55 [NASA ADS] [CrossRef] [Google Scholar]
- Abdo, A. A., Ackermann, M., Ajello, M., et al. 2009c, ApJ, 699, 976 [NASA ADS] [CrossRef] [Google Scholar]
- Abdo, A. A., Ackermann, M., Ajello, M., et al. 2009d, ApJ, 707, L142 [NASA ADS] [CrossRef] [Google Scholar]
- Abdo, A. A., Ackermann, M., Ajello, M., et al. 2010a, Science, 328, 725 [NASA ADS] [CrossRef] [PubMed] [Google Scholar]
- Abdo, A. A., Ackermann, M., Ajello, M., et al. 2010b, ApJS, 188, 405 [NASA ADS] [CrossRef] [Google Scholar]
- Abdo, A. A., Ackermann, M., Ajello, M., et al. 2010c, ApJ, 720, 912 [NASA ADS] [CrossRef] [Google Scholar]
- Abdo, A. A., Ackermann, M., Ajello, M., et al. 2010d, ApJ, 719, 1433 [NASA ADS] [CrossRef] [Google Scholar]
- Abdo, A. A., Ackermann, M., Ajello, M., et al. 2010e, ApJ, 722, 520 [NASA ADS] [CrossRef] [Google Scholar]
- Abramowski, A., Acero, F., Aharonian, F., et al. 2012, ApJ, 746, 151 [NASA ADS] [CrossRef] [Google Scholar]
- Acciari, V. A., & Aliu, E., Arlen, T., et al. 2009, Science, 325, 444 [NASA ADS] [CrossRef] [PubMed] [Google Scholar]
- Acero, F., Ackermann, M., Ajello, M., et al. 2015, ApJS, 218, 23 [Google Scholar]
- Ackermann, M., Ajello, M., Atwood, W. B., et al. 2015, ApJ, 810, 14 [NASA ADS] [CrossRef] [Google Scholar]
- Ackermann, M., Ajello, M., Baldini, L., et al. 2016a, ApJ, 826, 1 [NASA ADS] [CrossRef] [Google Scholar]
- Ackermann, M., Anantua, R., Asano, K., et al. 2016b, ApJ, 824, L20 [NASA ADS] [CrossRef] [Google Scholar]
- Aharonian, F., Akhperjanian, A. G., Bazer-Bachi, A. R., et al. 2006, Science, 314, 1424 [NASA ADS] [CrossRef] [PubMed] [Google Scholar]
- Aharonian, F., Akhperjanian, A. G., Bazer-Bachi, A. R., et al. 2007, ApJ, 664, L71 [Google Scholar]
- Albert, J., Aliu, E., Anderhub, H., et al. 2008, ApJ, 685, L23 [NASA ADS] [CrossRef] [Google Scholar]
- Aleksic, J., Ansoldi, S., Antonelli, L. A., et al. 2014, Science, 346, 1080 [NASA ADS] [CrossRef] [Google Scholar]
- Angioni, R., Grandi, P., Torresi, E., Vignali, C., & Knödlseder, J. 2017, Astropart. Phys., 92, 42 [NASA ADS] [CrossRef] [Google Scholar]
- Atwood, W., Abdo, A., et al. 2009, ApJ, 697, 1071 [NASA ADS] [CrossRef] [Google Scholar]
- Baghmanyan, V., & Sahakyan, N. 2018, Int. J. Mod. Phys. D, in press [Google Scholar]
- Baghmanyan, V., Gasparyan, S., & Sahakyan, N. 2017, ApJ, 848, 111 [NASA ADS] [CrossRef] [Google Scholar]
- Bonnoli, G., Ghisellini, G., Foschini, L., Tavecchio, F., & Ghirlanda, G. 2011, MNRAS, 410, 368 [NASA ADS] [CrossRef] [Google Scholar]
- Brown, A. M. 2013, MNRAS, 431, 824 [Google Scholar]
- Brown, A. M., & Adams, J. 2011, MNRAS, 413, 2785 [NASA ADS] [CrossRef] [Google Scholar]
- Brown, A. M., BÅ’hm, C., Graham, J., et al. 2017, Phys. Rev. D, 95, 063018 [NASA ADS] [CrossRef] [Google Scholar]
- Casadio, C., Gómez, J. L., Grandi, P., et al. 2015, ApJ, 808, 162 [NASA ADS] [CrossRef] [Google Scholar]
- D’Ammando, F., Orienti, M., Finke, J., et al. 2012, MNRAS, 426, 317 [NASA ADS] [CrossRef] [Google Scholar]
- D’Ammando, F., Orienti, M., Finke, J., et al. 2013, MNRAS, 436, 191 [NASA ADS] [CrossRef] [Google Scholar]
- Dyrda, M., Wierzcholska, A., Hervet, O., et al. 2015, ArXiv e-prints [arXiv:1509.06851] [Google Scholar]
- Fanaroff, B. L., & Riley, J. M. 1974, MNRAS, 167, 31P [Google Scholar]
- Fanti, C., Fanti, R., Dallacasa, D., et al. 1995, A&A, 302, 317 [NASA ADS] [Google Scholar]
- Foschini, L., Ghisellini, G., Kovalev, Y. Y., et al. 2011a, MNRAS, 413, 1671 [NASA ADS] [CrossRef] [Google Scholar]
- Foschini, L., Ghisellini, G., Tavecchio, F., Bonnoli, G., & Stamerra, A. 2011b, A&A, 530, A77 [NASA ADS] [CrossRef] [EDP Sciences] [Google Scholar]
- Foschini, L., Bonnoli, G., Ghisellini, G., et al. 2013, A&A, 555, A138 [NASA ADS] [CrossRef] [EDP Sciences] [Google Scholar]
- Gallo, L. C. 2006, MNRAS, 368, 479 [NASA ADS] [Google Scholar]
- Gebhardt, K., Adams, J., Richstone, D., et al. 2011, ApJ, 729, 119 [NASA ADS] [CrossRef] [Google Scholar]
- Gelderman, R., & Whittle, M. 1994, ApJS, 91, 491 [NASA ADS] [CrossRef] [Google Scholar]
- Ghisellini, G., Maraschi, L., & Tavecchio, F. 2009, MNRAS, 396, L105 [NASA ADS] [Google Scholar]
- Grandi, P., Torresi, E., & Stanghellini, C. 2012, ApJ, 751, L3 [NASA ADS] [CrossRef] [Google Scholar]
- Hayashida, M., Nalewajko, K., Madejski, G. M., et al. 2015, ApJ, 807, 79 [Google Scholar]
- Janiak, M., Sikora, M., & Moderski, R. 2016, MNRAS, 458, 2360 [NASA ADS] [CrossRef] [Google Scholar]
- Jones, P. A., Lloyd, B. D., & McAdam, W. B. 2001, MNRAS, 325, 817 [NASA ADS] [CrossRef] [Google Scholar]
- Kadler, M., Eisenacher, D., Ros, E., et al. 2012, A&A, 538, L1 [NASA ADS] [CrossRef] [EDP Sciences] [Google Scholar]
- Kataoka, J., Stawarz, Ł., Cheung, C. C., et al. 2010, ApJ, 715, 554 [NASA ADS] [CrossRef] [Google Scholar]
- Lenain, J.-P., Boisson, C., Sol, H., & Katarzyński, K. 2008, A&A, 478, 111 [NASA ADS] [CrossRef] [EDP Sciences] [Google Scholar]
- Levinson, A., & Rieger, F. 2011, ApJ, 730, 123 [NASA ADS] [CrossRef] [Google Scholar]
- Lott, B., Escande, L., Larsson, S., & Ballet, J. 2012, A&A, 544, A6 [NASA ADS] [CrossRef] [EDP Sciences] [Google Scholar]
- Massaro, E., Tramacere, A., Perri, M., Giommi, P., & Tosti, G. 2006, A&A, 448, 861 [NASA ADS] [CrossRef] [EDP Sciences] [Google Scholar]
- Mattox, J. R., & Bertsch, D. L., et al. 1996, ApJ, 461, 396 [NASA ADS] [CrossRef] [Google Scholar]
- Nalewajko, K. 2013, MNRAS, 430, 1324 [NASA ADS] [CrossRef] [Google Scholar]
- Nolan, P. L., Abdo, A. A., Ackermann, M., et al. 2012, ApJS, 199, 31 [NASA ADS] [CrossRef] [Google Scholar]
- O’Dea, C. P., & Baum, S. A. 1997, AJ, 113, 148 [NASA ADS] [CrossRef] [Google Scholar]
- Osterbrock, D. E., & Pogge, R. W. 1985, ApJ, 297, 166 [NASA ADS] [CrossRef] [Google Scholar]
- Paliya, V. S., Sahayanathan, S., Parker, M. L., et al. 2014, ApJ, 789, 143 [NASA ADS] [CrossRef] [Google Scholar]
- Rani, B., Lott, B., Krichbaum, T. P., Fuhrmann, L., & Zensus, J. A. 2013, A&A, 557, A71 [NASA ADS] [CrossRef] [EDP Sciences] [Google Scholar]
- Rieger, F. M. 2017, in 6th Int. Symp. on High Energy Gamma-Ray Astronomy, AIP Conf. Ser., 1792, 020008 [Google Scholar]
- Sahakyan, N., Yang, R., Aharonian, F. A., & Rieger, F. M. 2013, ApJ, 770, L6 [NASA ADS] [CrossRef] [Google Scholar]
- Sahakyan, N., Zargaryan, D., & Baghmanyan, V. 2015, A&A, 574, A88 [NASA ADS] [CrossRef] [EDP Sciences] [Google Scholar]
- Saito, S., Stawarz, Ł., Tanaka, Y. T., et al. 2013, ApJ, 766, L11 [NASA ADS] [CrossRef] [Google Scholar]
- Tanaka, Y. T., Doi, A., Inoue, Y., et al. 2015, ApJ, 799, L18 [NASA ADS] [CrossRef] [Google Scholar]
- Tavecchio, F., & Ghisellini, G. 2008, MNRAS, 385, L98 [NASA ADS] [CrossRef] [Google Scholar]
- Tavecchio, F., & Ghisellini, G. 2014, MNRAS, 443, 1224 [NASA ADS] [CrossRef] [Google Scholar]
- Urry, C. M., & Padovani, P. 1995, PASP, 107, 803 [NASA ADS] [CrossRef] [Google Scholar]
- Waggett, P. C., Warner, P. J., & Baldwin, J. E. 1977, MNRAS, 181, 465 [NASA ADS] [CrossRef] [Google Scholar]
- Yang, R.-Z., Sahakyan, N., de Ona Wilhelmi, E., Aharonian, F., & Rieger, F. 2012, A&A, 542, A19 [NASA ADS] [CrossRef] [EDP Sciences] [Google Scholar]
- Zargaryan, D., Gasparyan, S., Baghmanyan, V., & Sahakyan, N. 2017, A&A, 608, A37 [NASA ADS] [CrossRef] [EDP Sciences] [Google Scholar]
All Tables
Results of the Fermi-LAT observation of nonblazar AGNs from August 4 2008 to August 4 2015.
All Figures
|
Fig. 1 Left panel: flux (E > 100 MeV) versus photon spectral index of FRIs, FRIIs, SSRQs, and NLSy1s. Right panel: photon spectral index versus γ-ray luminosity of the considered sources as compared with similar properties of blazars (light blue ellipse for FSRQs and light red for BL Lacs). Inboth plots, FRIs, FRIIs, SSRQs, and NLSY1s are shown with red, blue, cyan, and green colors, respectively. |
| In the text | |
|
Fig. 2 Spectra of NGC 1275, Cen A core, NGC 6251, PKS 0625-35, 3C 380, SBS 0846+513, 1H 0323+342, and PMN J0948+0022 measured in the energy range from 100 MeV to 300 GeV, which showed deviation from the simple PL model above several GeV (see the text). The best fit models obtained with gtlike are depicted together with spectral points, which have been obtained by separately running gtlike for smaller energy intervals. The corresponding parameters are given in Table 2. |
| In the text | |
|
Fig. 3 Light curves of NGC 1275, 3C 120, 1H 0323+342, SBS 0846+513, and PMN J0948+0022. The light curves are calculated with the standard gtlike tool for normal (blue) and adaptively-binned (red) timescales. |
| In the text | |
Current usage metrics show cumulative count of Article Views (full-text article views including HTML views, PDF and ePub downloads, according to the available data) and Abstracts Views on Vision4Press platform.
Data correspond to usage on the plateform after 2015. The current usage metrics is available 48-96 hours after online publication and is updated daily on week days.
Initial download of the metrics may take a while.