Fig. 9
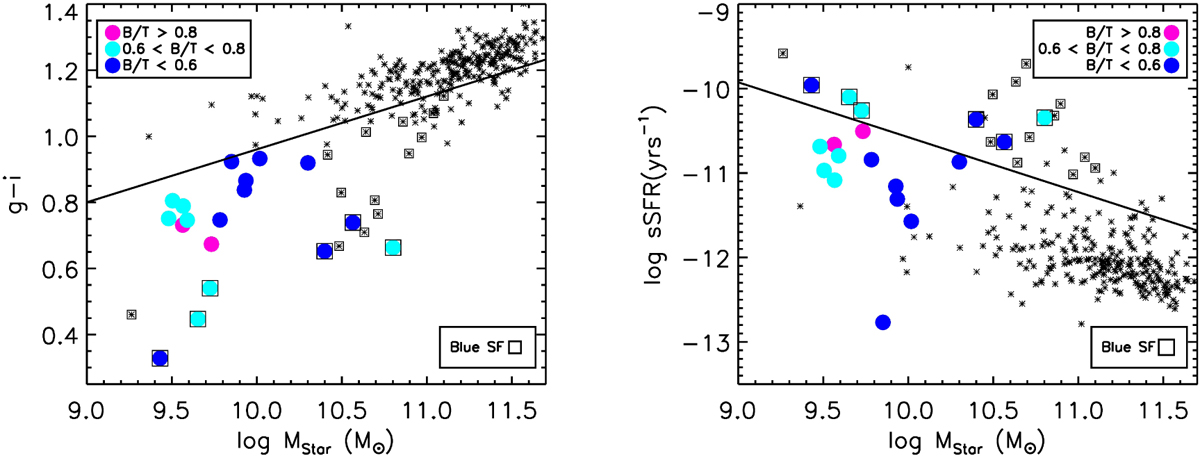
Colours and sSFRs as a function of the MStar (left and right panels, respectively) for the simulated SDGs (filled circles coloured according to the dynamical B∕T ratios). Observational results for isolated ETGs (black asterisks; Hernández-Toledo et al. 2010) are included. In the left panel, blue and red galaxies are separated by the black line reported by Lacerna et al. (2014), while in the right panel the black line depicts the limit between star-forming and passive galaxies (Lacerna et al. 2014). Galaxies that are blue and star-forming at the same time are marked with black open squares.
Current usage metrics show cumulative count of Article Views (full-text article views including HTML views, PDF and ePub downloads, according to the available data) and Abstracts Views on Vision4Press platform.
Data correspond to usage on the plateform after 2015. The current usage metrics is available 48-96 hours after online publication and is updated daily on week days.
Initial download of the metrics may take a while.