Fig. 6
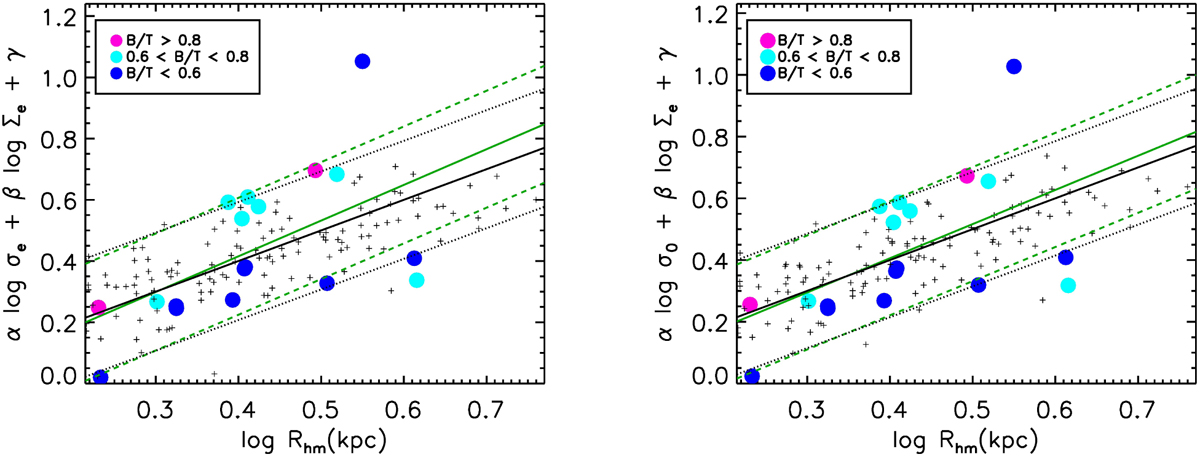
Fundamental plane for the simulated SDGs calculated with the parameters estimated for our clean ATLAS3D sample. The black line denotes the one-to-one relation and the green line shows the best fit to our simulated SDGs (solid circles, coloured according to the dynamical B/T ratios). The rms is 0.19 and 0.18 for the least squares regression (dashed green lines) when considering velocity dispersion within Reff and central velocity dispersion, respectively, and the corresponding regression for the one-to-one relation (rms = 0.19 for both cases) is shown by dotted black lines.
Current usage metrics show cumulative count of Article Views (full-text article views including HTML views, PDF and ePub downloads, according to the available data) and Abstracts Views on Vision4Press platform.
Data correspond to usage on the plateform after 2015. The current usage metrics is available 48-96 hours after online publication and is updated daily on week days.
Initial download of the metrics may take a while.