Fig. 5
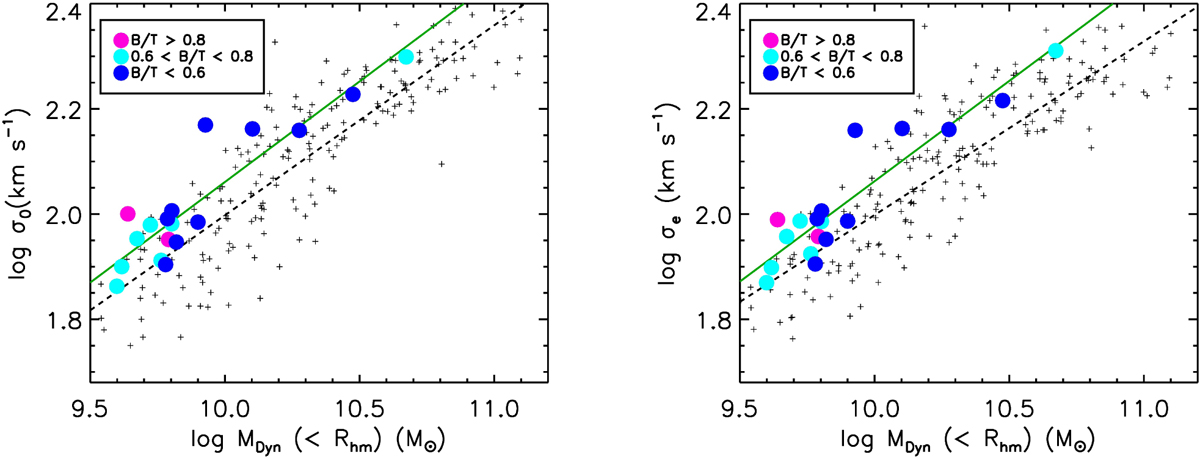
Faber–Jackson relation for the simulated SDGs (filled circles, coloured according to the dynamical B/T ratios) estimated by using σ0 (left panel) or σe (right panel). For comparison, the corresponding relations obtained from the clean ATLAS3D sample are included (see Sect. 4). The linear regression to the simulated data (green solid lines) and observational data (black dashed lines) are depicted for comparison.
Current usage metrics show cumulative count of Article Views (full-text article views including HTML views, PDF and ePub downloads, according to the available data) and Abstracts Views on Vision4Press platform.
Data correspond to usage on the plateform after 2015. The current usage metrics is available 48-96 hours after online publication and is updated daily on week days.
Initial download of the metrics may take a while.