Fig. 4
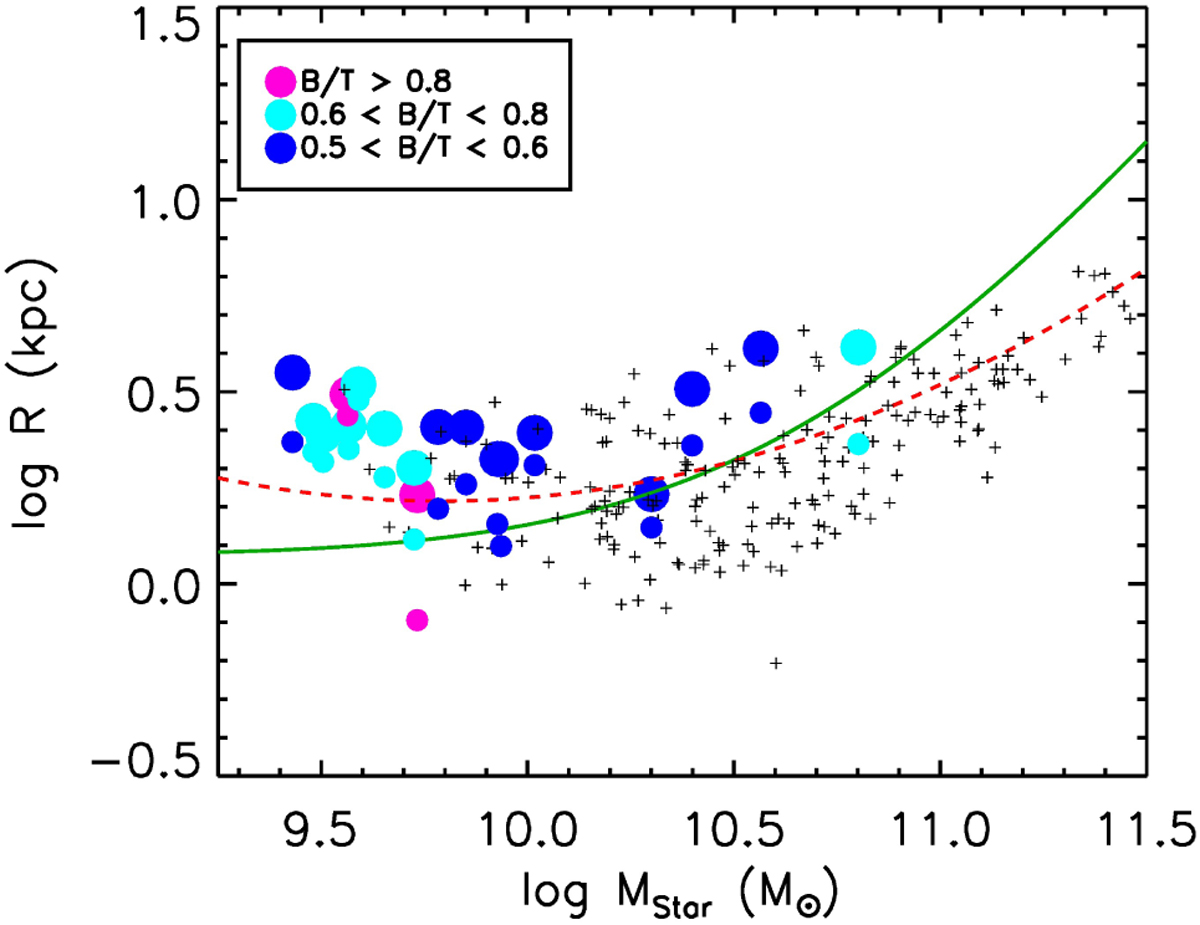
Mass-size relation estimated for the simulated SDGs (Rhm, big circles, and Reff, small circles, both coloured according to the dynamical B/T ratios), ETGs from the clean ATLAS3D sample (black crosses), and the observed relations reported by Mosleh et al. (2013; green solid line) and Bernardi et al. (2014; red dashed line) for ETGs.
Current usage metrics show cumulative count of Article Views (full-text article views including HTML views, PDF and ePub downloads, according to the available data) and Abstracts Views on Vision4Press platform.
Data correspond to usage on the plateform after 2015. The current usage metrics is available 48-96 hours after online publication and is updated daily on week days.
Initial download of the metrics may take a while.