Free Access
Fig. 3
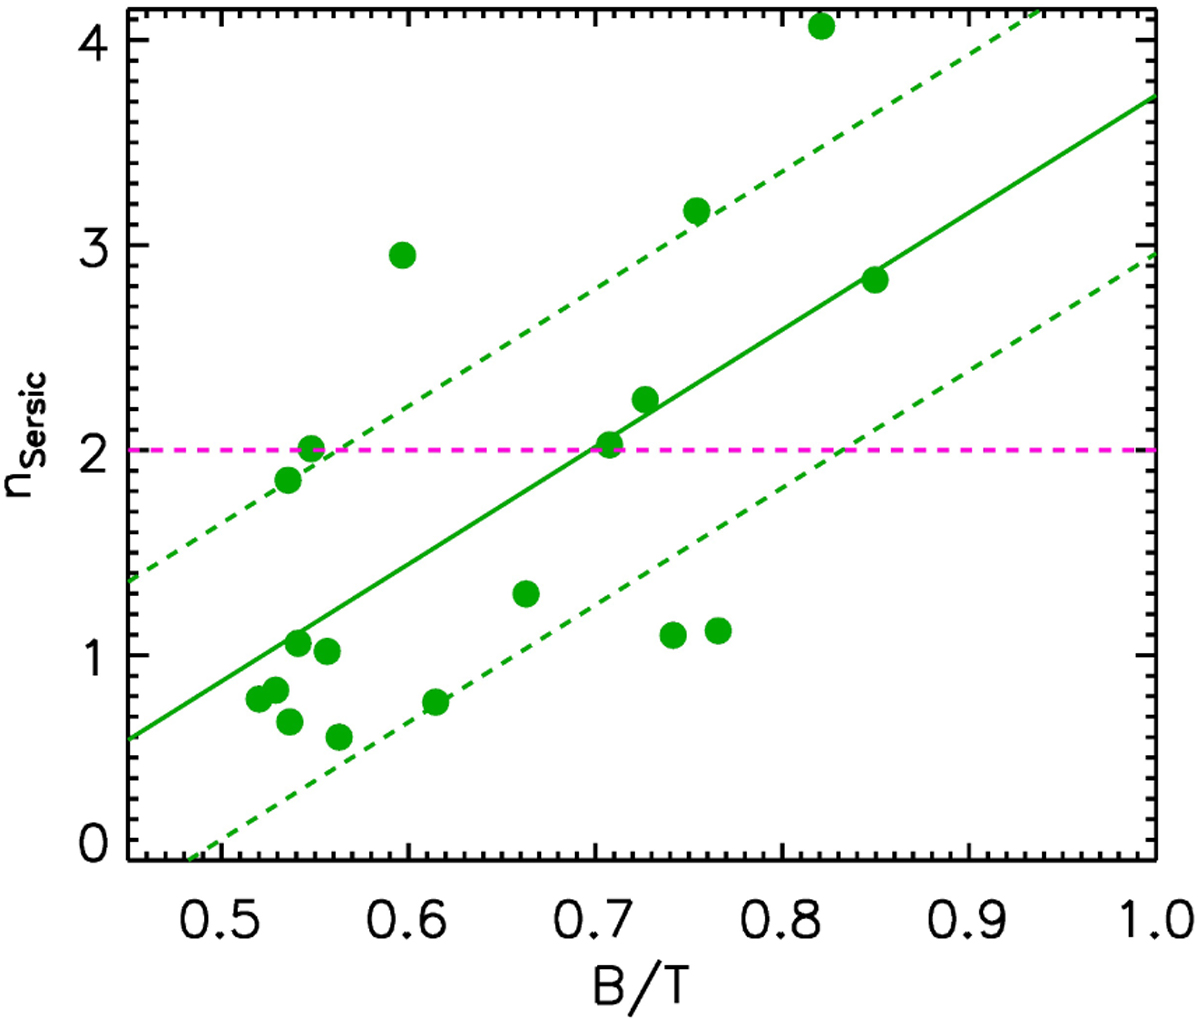
Spheroid Sersic index obtained for the simulated SDGs as a function of their dynamical B/T mass ratios. The green solid and dashed lines represent the best linear regression fit and the 1σ dispersion. The magenta dashed line denotes n = 2, which is often assumed to be the limit between classical and pseudo-bulges.
Current usage metrics show cumulative count of Article Views (full-text article views including HTML views, PDF and ePub downloads, according to the available data) and Abstracts Views on Vision4Press platform.
Data correspond to usage on the plateform after 2015. The current usage metrics is available 48-96 hours after online publication and is updated daily on week days.
Initial download of the metrics may take a while.