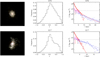
Fig. B.1
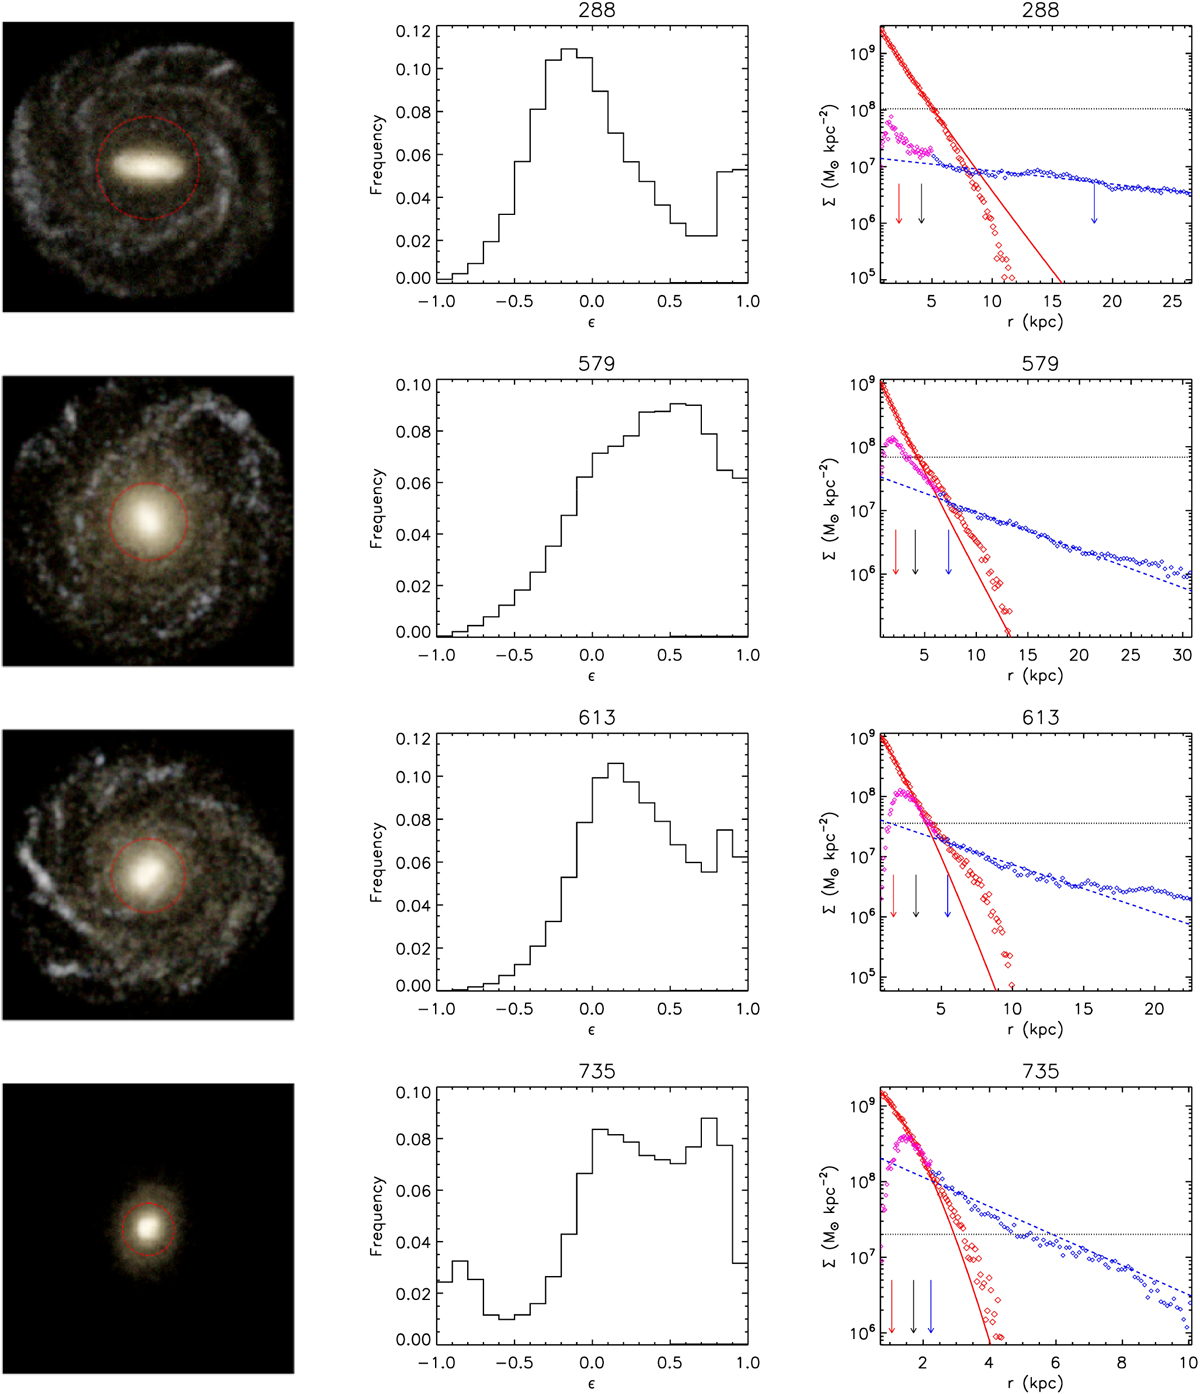
Left panels: synthetic images of 18 SDGs obtained with the SKIRT code (Baes et al. 2005) with a box side of 30 kpc. The red circles show the limit radii for SDSS observability (see Appendix B for details). Middle panels: distributions of the ϵ parameter for star particles within the optical radius. Right panels: projected stellar-mass surface profiles for the spheroids (red diamonds) and the disc components (blue diamonds). Part of the disc components coexist spatially with the spheroid component (magenta diamonds). The best fit Sersic profile for the spheroid component (red solid lines) and the exponential profiles for the discs (blue dashed lines) are also included. We indicate with a red, black, and blue arrow the RSersic, Rhm , and Rd (see Table A.1). We also include the total surface brightness at the limit radius where the galaxy could be detected with the SDSS (black dotted line). The relations are shown out to Ropt. The rows show galaxies in order of descending stellar mass. The galaxy ID is indicated above each middle and right panel.
Current usage metrics show cumulative count of Article Views (full-text article views including HTML views, PDF and ePub downloads, according to the available data) and Abstracts Views on Vision4Press platform.
Data correspond to usage on the plateform after 2015. The current usage metrics is available 48-96 hours after online publication and is updated daily on week days.
Initial download of the metrics may take a while.