Fig. 14
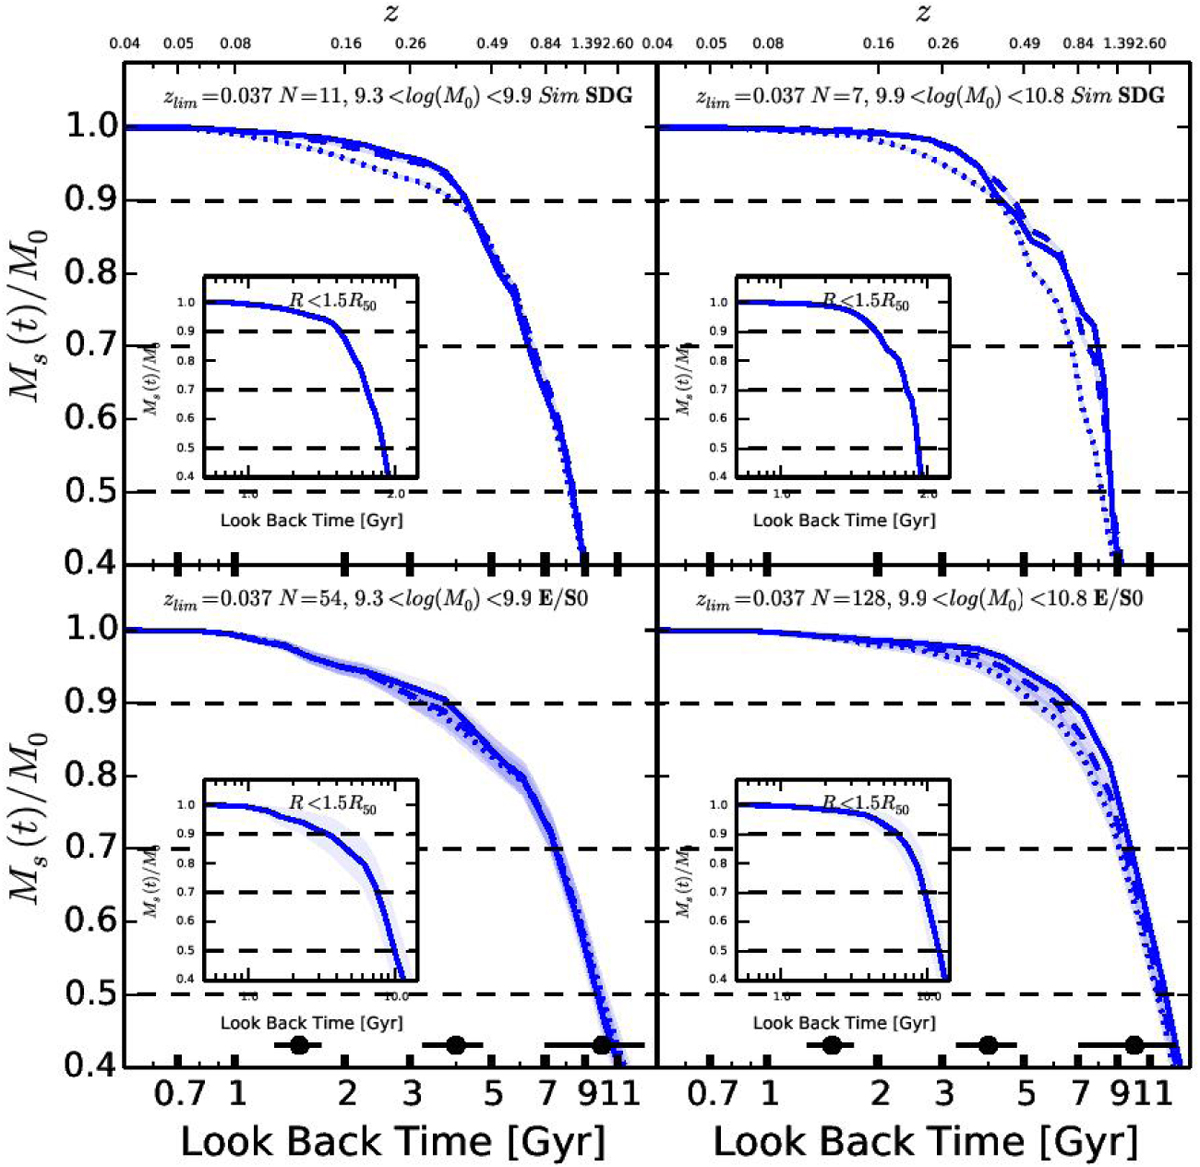
Average global and radial normalised MGH for our simulations (top) and MaNGA ETGs at z < 0.037 (bottom). We make the division between low (left panels) and high (right panels) stellar mass, adopting log (MStar) = 9.9 as a threshold. Radial bins of [0–0.5], [0.5–1.0], and [1.0–1.5] Rhm are represented by solid, dashed, and dotted lines, respectively.
Current usage metrics show cumulative count of Article Views (full-text article views including HTML views, PDF and ePub downloads, according to the available data) and Abstracts Views on Vision4Press platform.
Data correspond to usage on the plateform after 2015. The current usage metrics is available 48-96 hours after online publication and is updated daily on week days.
Initial download of the metrics may take a while.