Fig. 10
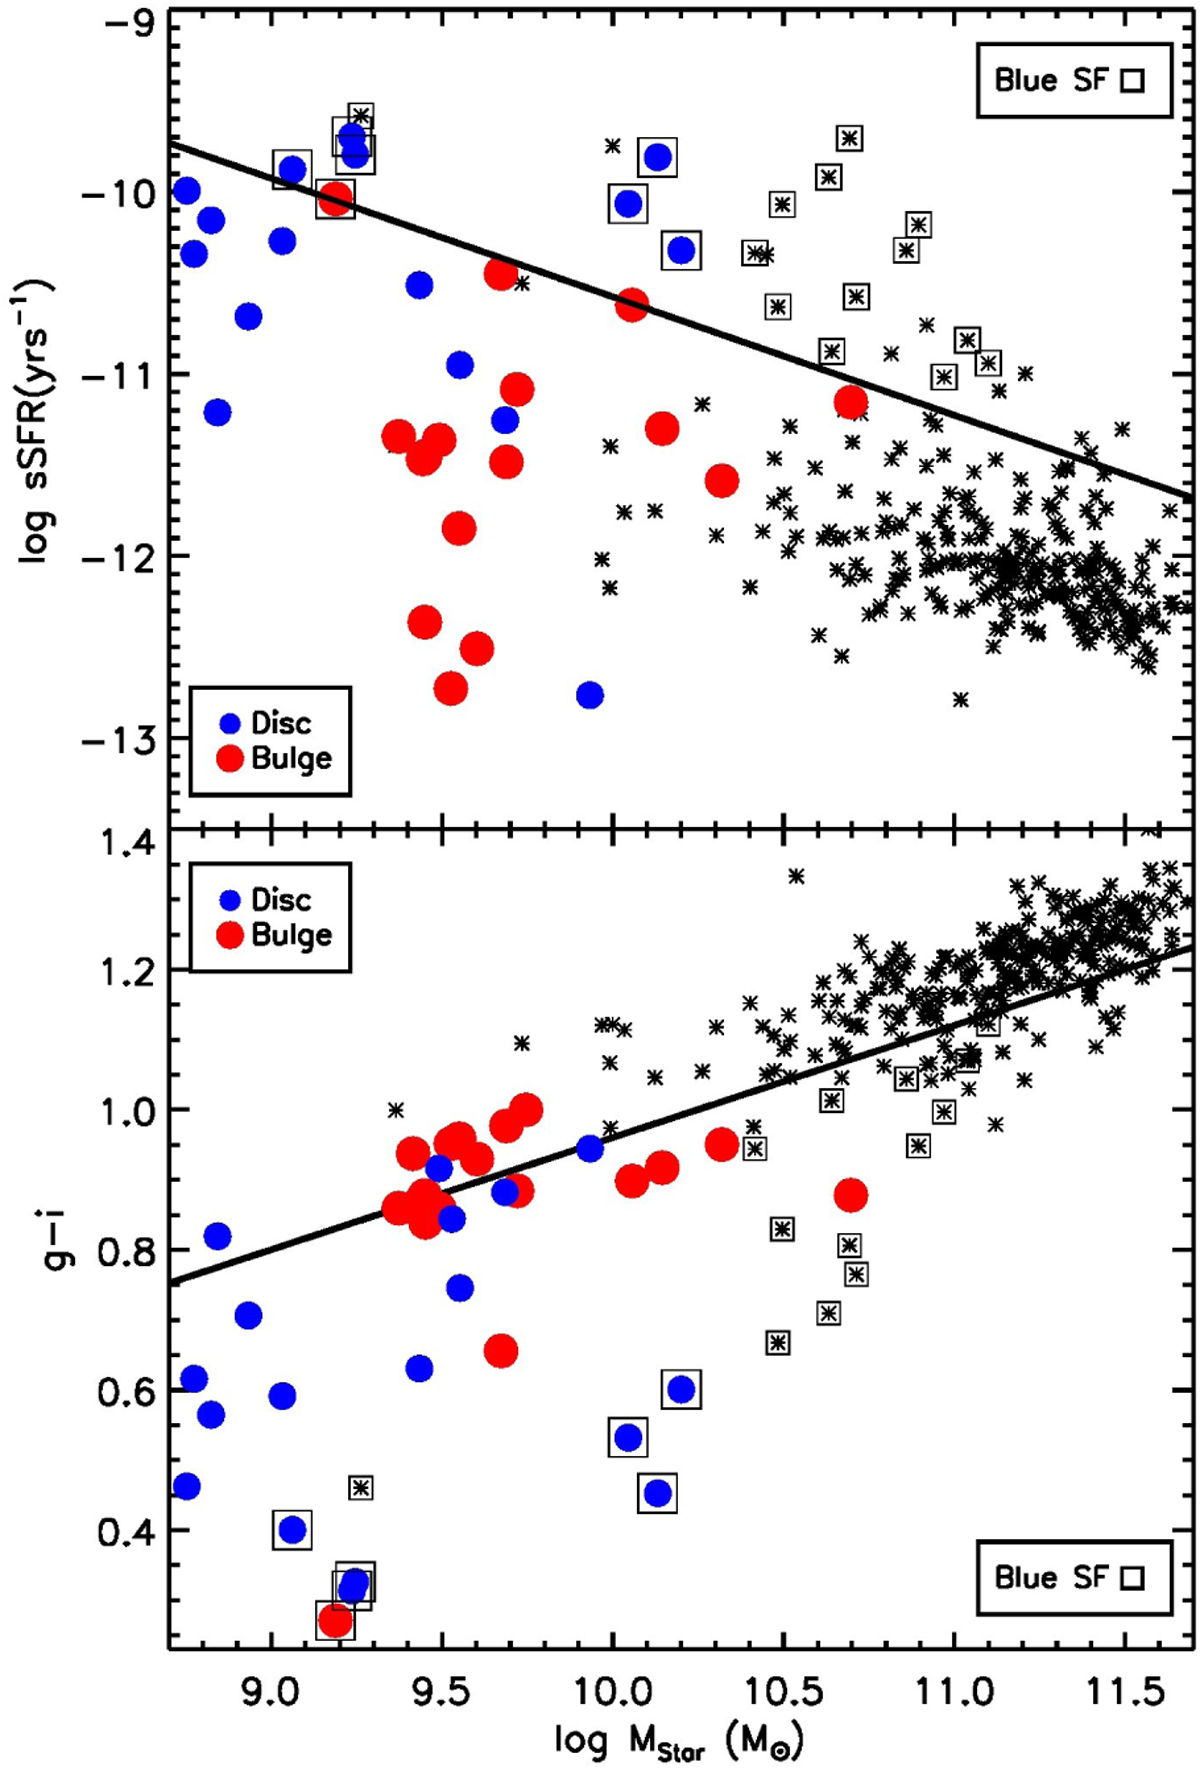
Properties of the spheroid (red circles) and disc (blue circles) components: g–i (top panel) and sSFR (bottom panel) as a function of MStar. For comparison, we include the same observations as in Fig. 9 (black asterisks). We depict blue star-forming galactic objects as black open squares, and the limiting lines reported by Lacerna et al. (2014) between red and blue galaxies in the bottom panel, and between star-forming and non-star-forming galaxies in the top panel.
Current usage metrics show cumulative count of Article Views (full-text article views including HTML views, PDF and ePub downloads, according to the available data) and Abstracts Views on Vision4Press platform.
Data correspond to usage on the plateform after 2015. The current usage metrics is available 48-96 hours after online publication and is updated daily on week days.
Initial download of the metrics may take a while.