Fig. 4
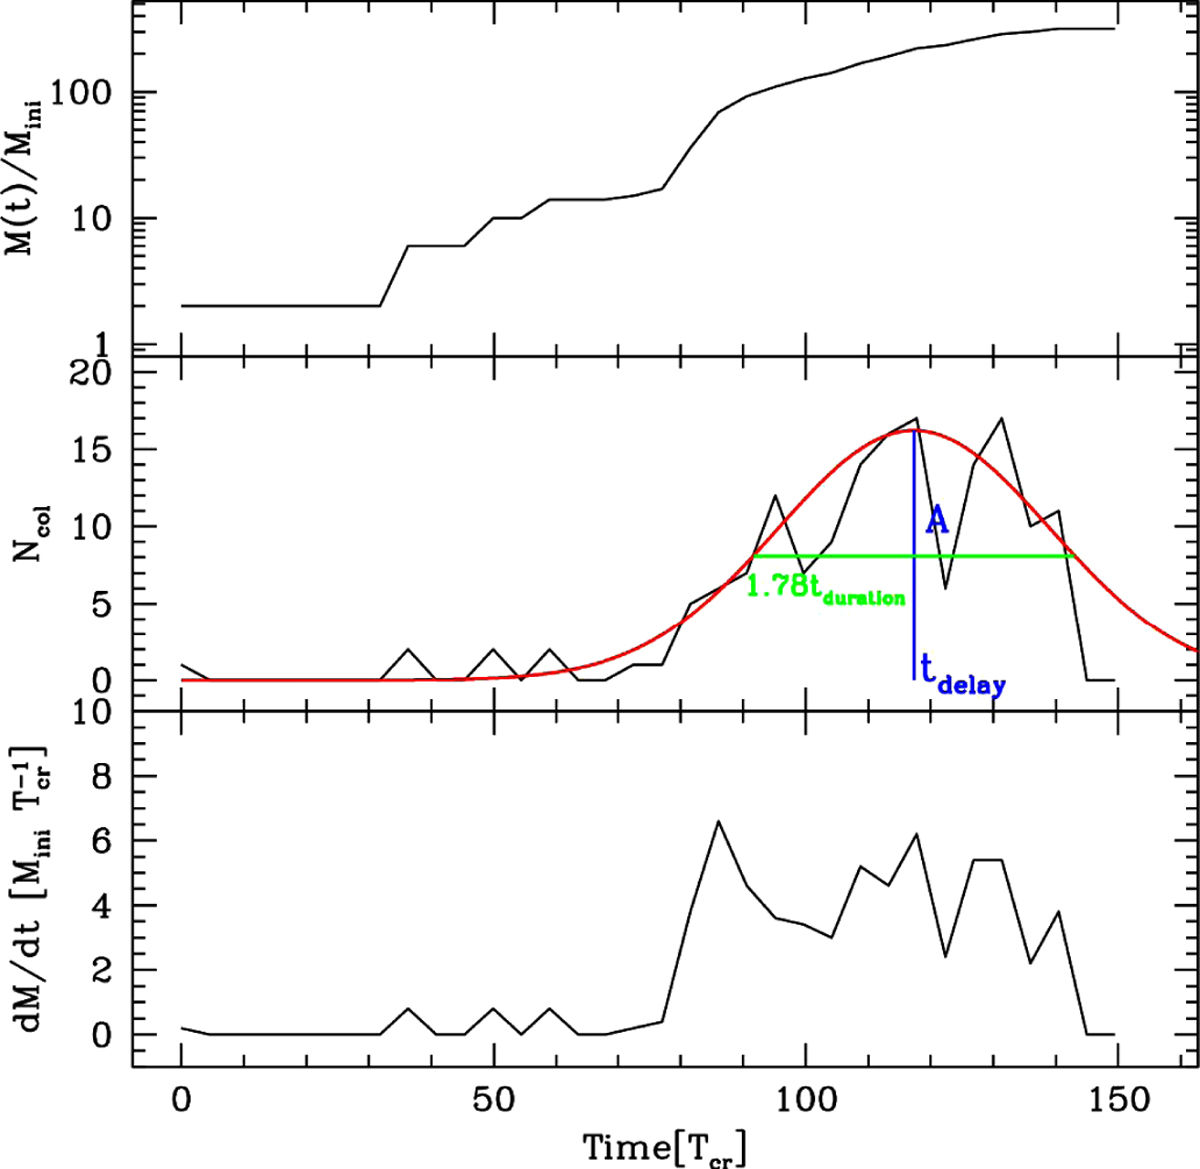
Top panel: mass evolution of the runaway star (Mmax(t)∕Mini) in a cluster with N = 5000 stars. Each of these stars has an initial mass of Mstar = 2M⊙ and an initial radius of Rstar = 200R⊙. Middle panel: the number of collisions in bins of 5 crossing times (Ncol) as function of the crossing time of the cluster is shown. The red line is the best Gaussian fit. Bottom panel: the mass growth rate d M∕dt in ![]() calculated in bins of 5 crossing times is shown.
calculated in bins of 5 crossing times is shown.
Current usage metrics show cumulative count of Article Views (full-text article views including HTML views, PDF and ePub downloads, according to the available data) and Abstracts Views on Vision4Press platform.
Data correspond to usage on the plateform after 2015. The current usage metrics is available 48-96 hours after online publication and is updated daily on week days.
Initial download of the metrics may take a while.