Fig. 12.
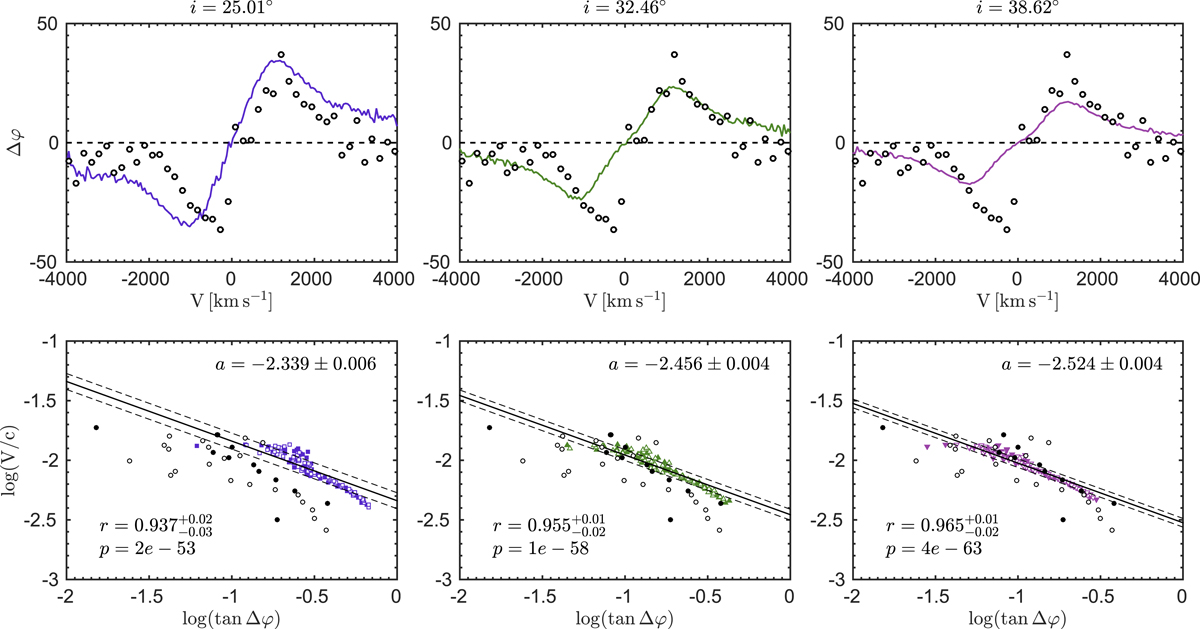
Modeled broad-line polarization position angle φ (upper panels) and velocities (lower panels) across Hα profiles for NGC 4051. In the upper panels, data obtained by the models are depicted as a line, while observed data are depicted by empty circles. In the lower panels, filled symbols are for the blue part of the line and the open symbols are for the red part of the line for model data. Black circles depict observed data. The solid black line represents the best fit. Values of the parameter a, correlation coefficient r, and the corresponding p values are shown.
Current usage metrics show cumulative count of Article Views (full-text article views including HTML views, PDF and ePub downloads, according to the available data) and Abstracts Views on Vision4Press platform.
Data correspond to usage on the plateform after 2015. The current usage metrics is available 48-96 hours after online publication and is updated daily on week days.
Initial download of the metrics may take a while.